Author Archives: admin

How to create a new Virtual server instance for VPC in IBM Cloud – Step by Step Guide

In this step by step guide we will create a new Virtual server instance for VPC on IBM Cloud. The creation of a virtual machine under this new option tends to be more complicated than creating a simple virtual machine in the Classic Infrastucture. Let’s get right to it.

Prerequisites

There are number of prerequisites that need fulfilling before the actual creation of the virtual machine.

Create an SSH key pair

The virtual machine will be created without a root password. In order to be able to log in to your new virtual machine you will need to use an SSH key pair which is to be generated manually.

We used an Ubuntu linux session to generate a key pair for the root user by executing the following command:

ssh-keygen -t rsa -C “root”

Generating public/private rsa key pair.
Enter file in which to save the key (/root/.ssh/id_rsa): /app/root
Enter passphrase (empty for no passphrase):

Enter same passphrase again:
Your identification has been saved in /app/root
Your public key has been saved in /app/root.pub

This procedure generates a public and a private key. We named the public key file to root.pub and the private key was automatically saved as root.

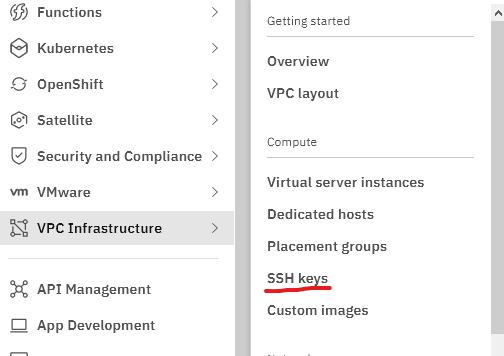
Open IBM Cloud in your browser and navigate to the SSH Keys. VPC Infrastructure -> SSH keys

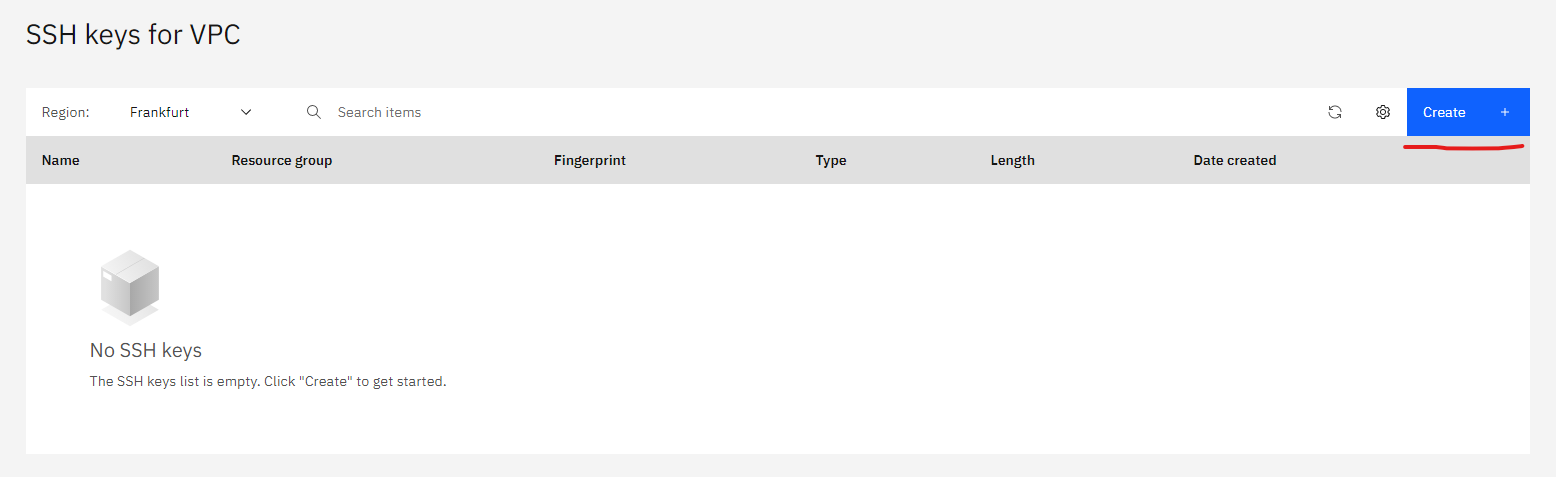
Click on Create at the SSH keys for VPC screen.

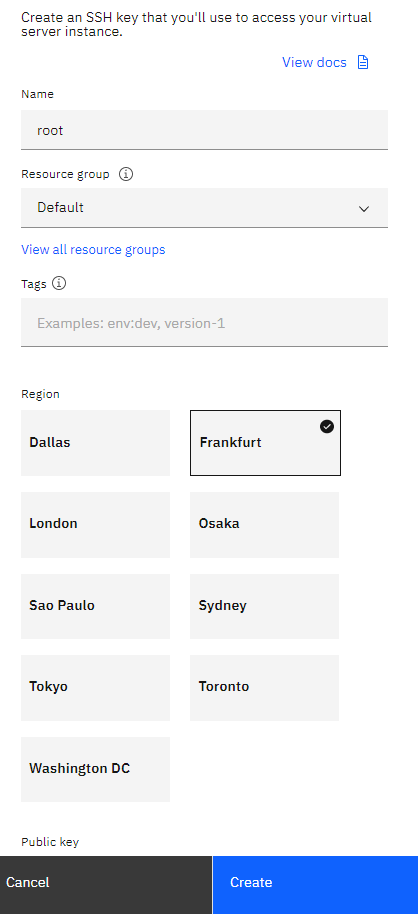
Fill in the information at the next pop up window. Name your certificate and copy paste the public key into the text area in the bottom ( we won’t show that ). If you filled in all the details correctly the Create button will turn blue. Click on that button to continue.

If you face an error here stating that the certificate is incorrect it might be that you tried to copy it across from a Linux shell by cat-ing the file. Open the public key in a text editor and copy it across from there.

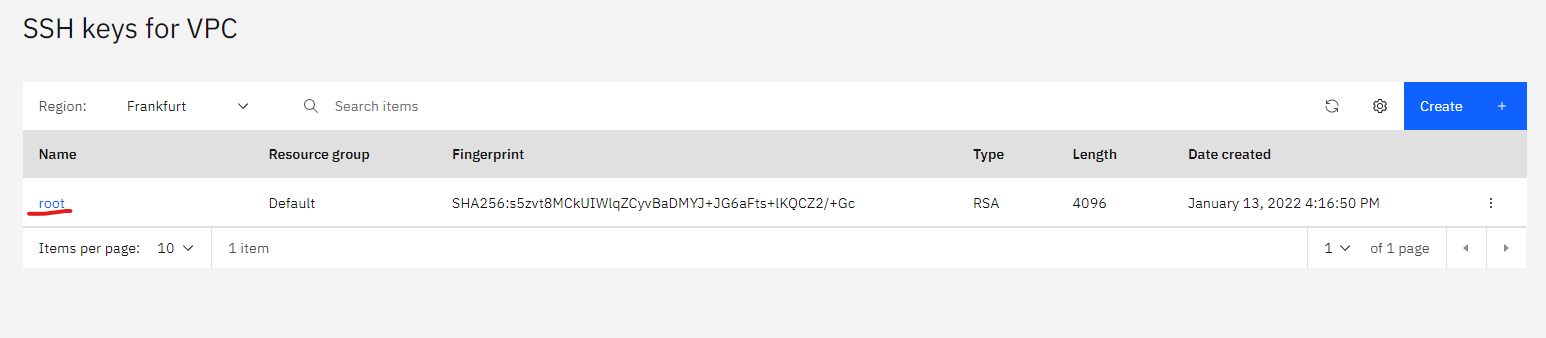
Once you have created the ssh key it will show up on the SSH keys for VPC list.

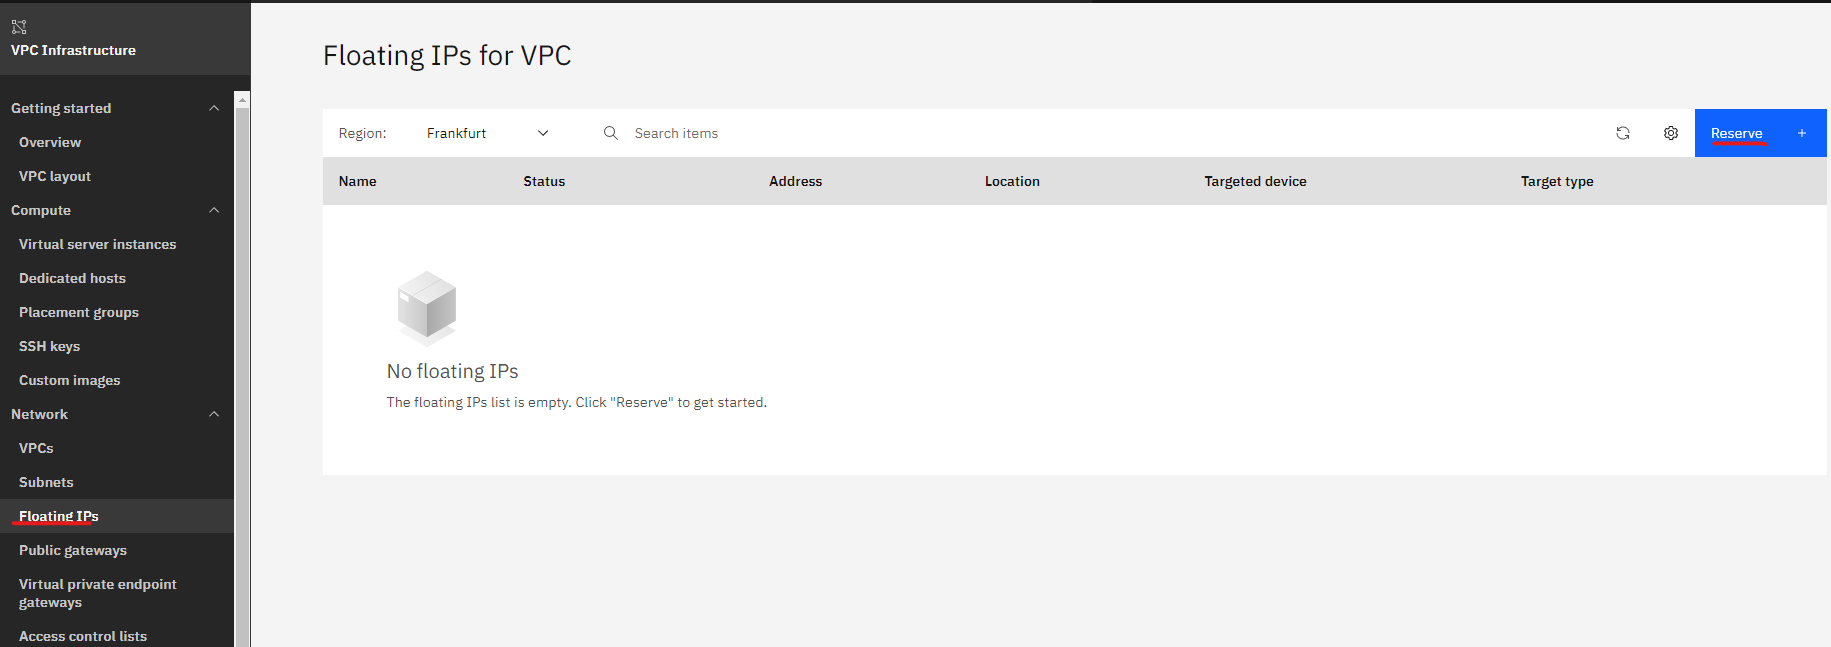
Create Floating IPs for VPC

Floating IPs are basically public ip addresses. To be able to access the server using SSH at the first time a floating ip will be bound to the Virtual server instance for VPC which we will create later on.

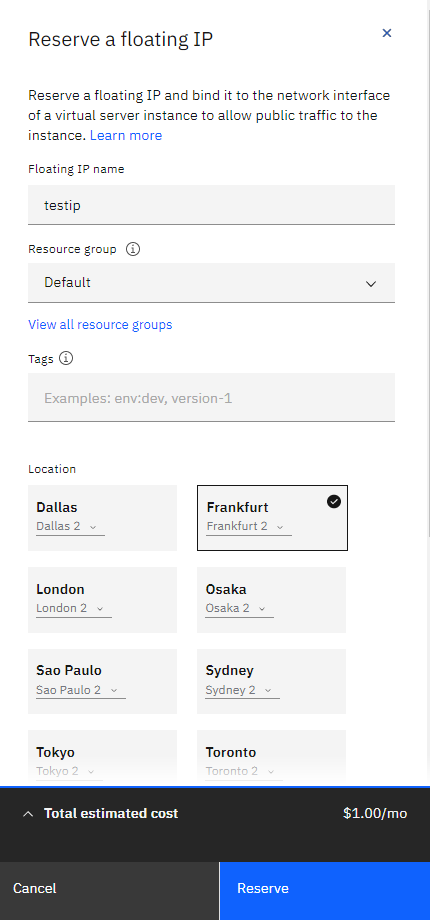
Navigate to VPC Infrastructure -> Floating IPs then click Reserve.

Enter the Floating IP name, then click on Reserve. We used testip for the name.

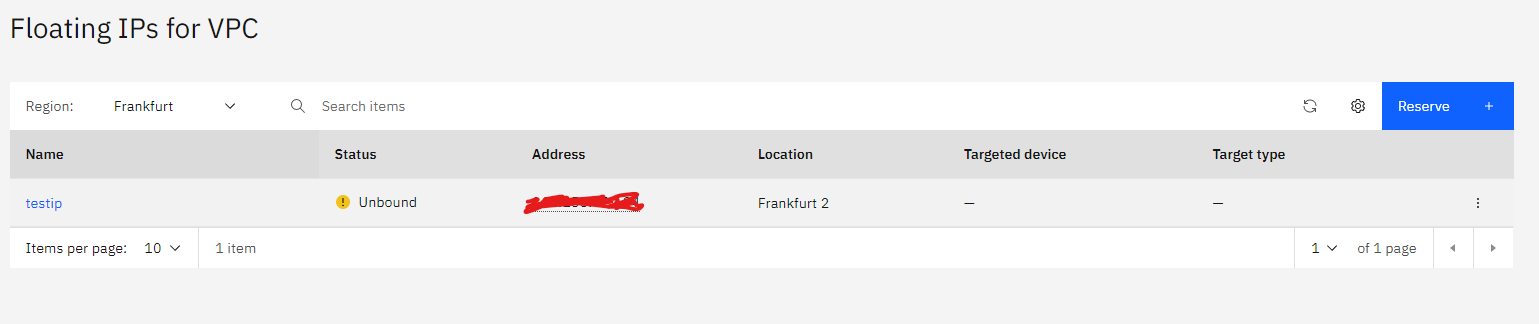
The floating ip is now created.

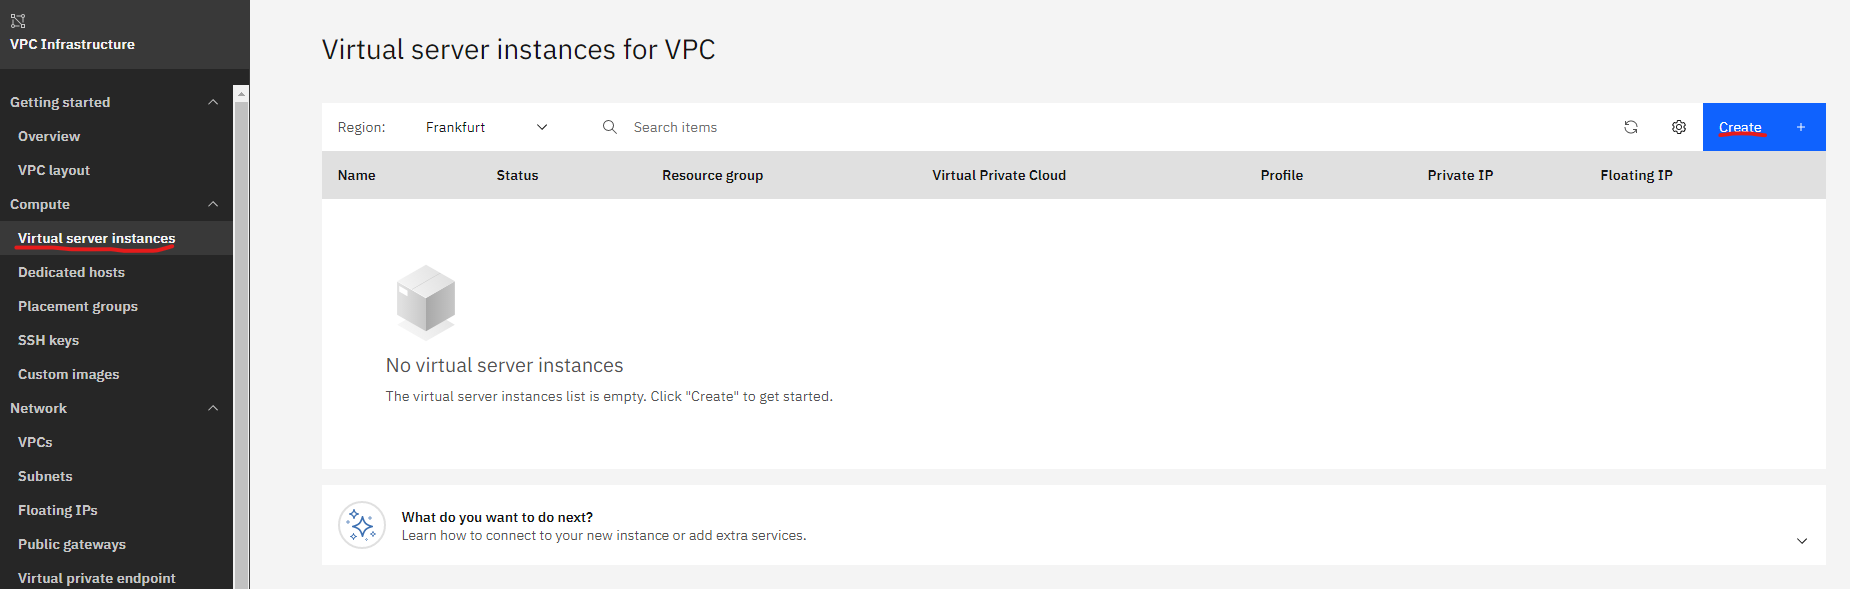
Create the Virtual server instance for VPC

Now we have the prerequisites in place it is time to create our VM for VPC.

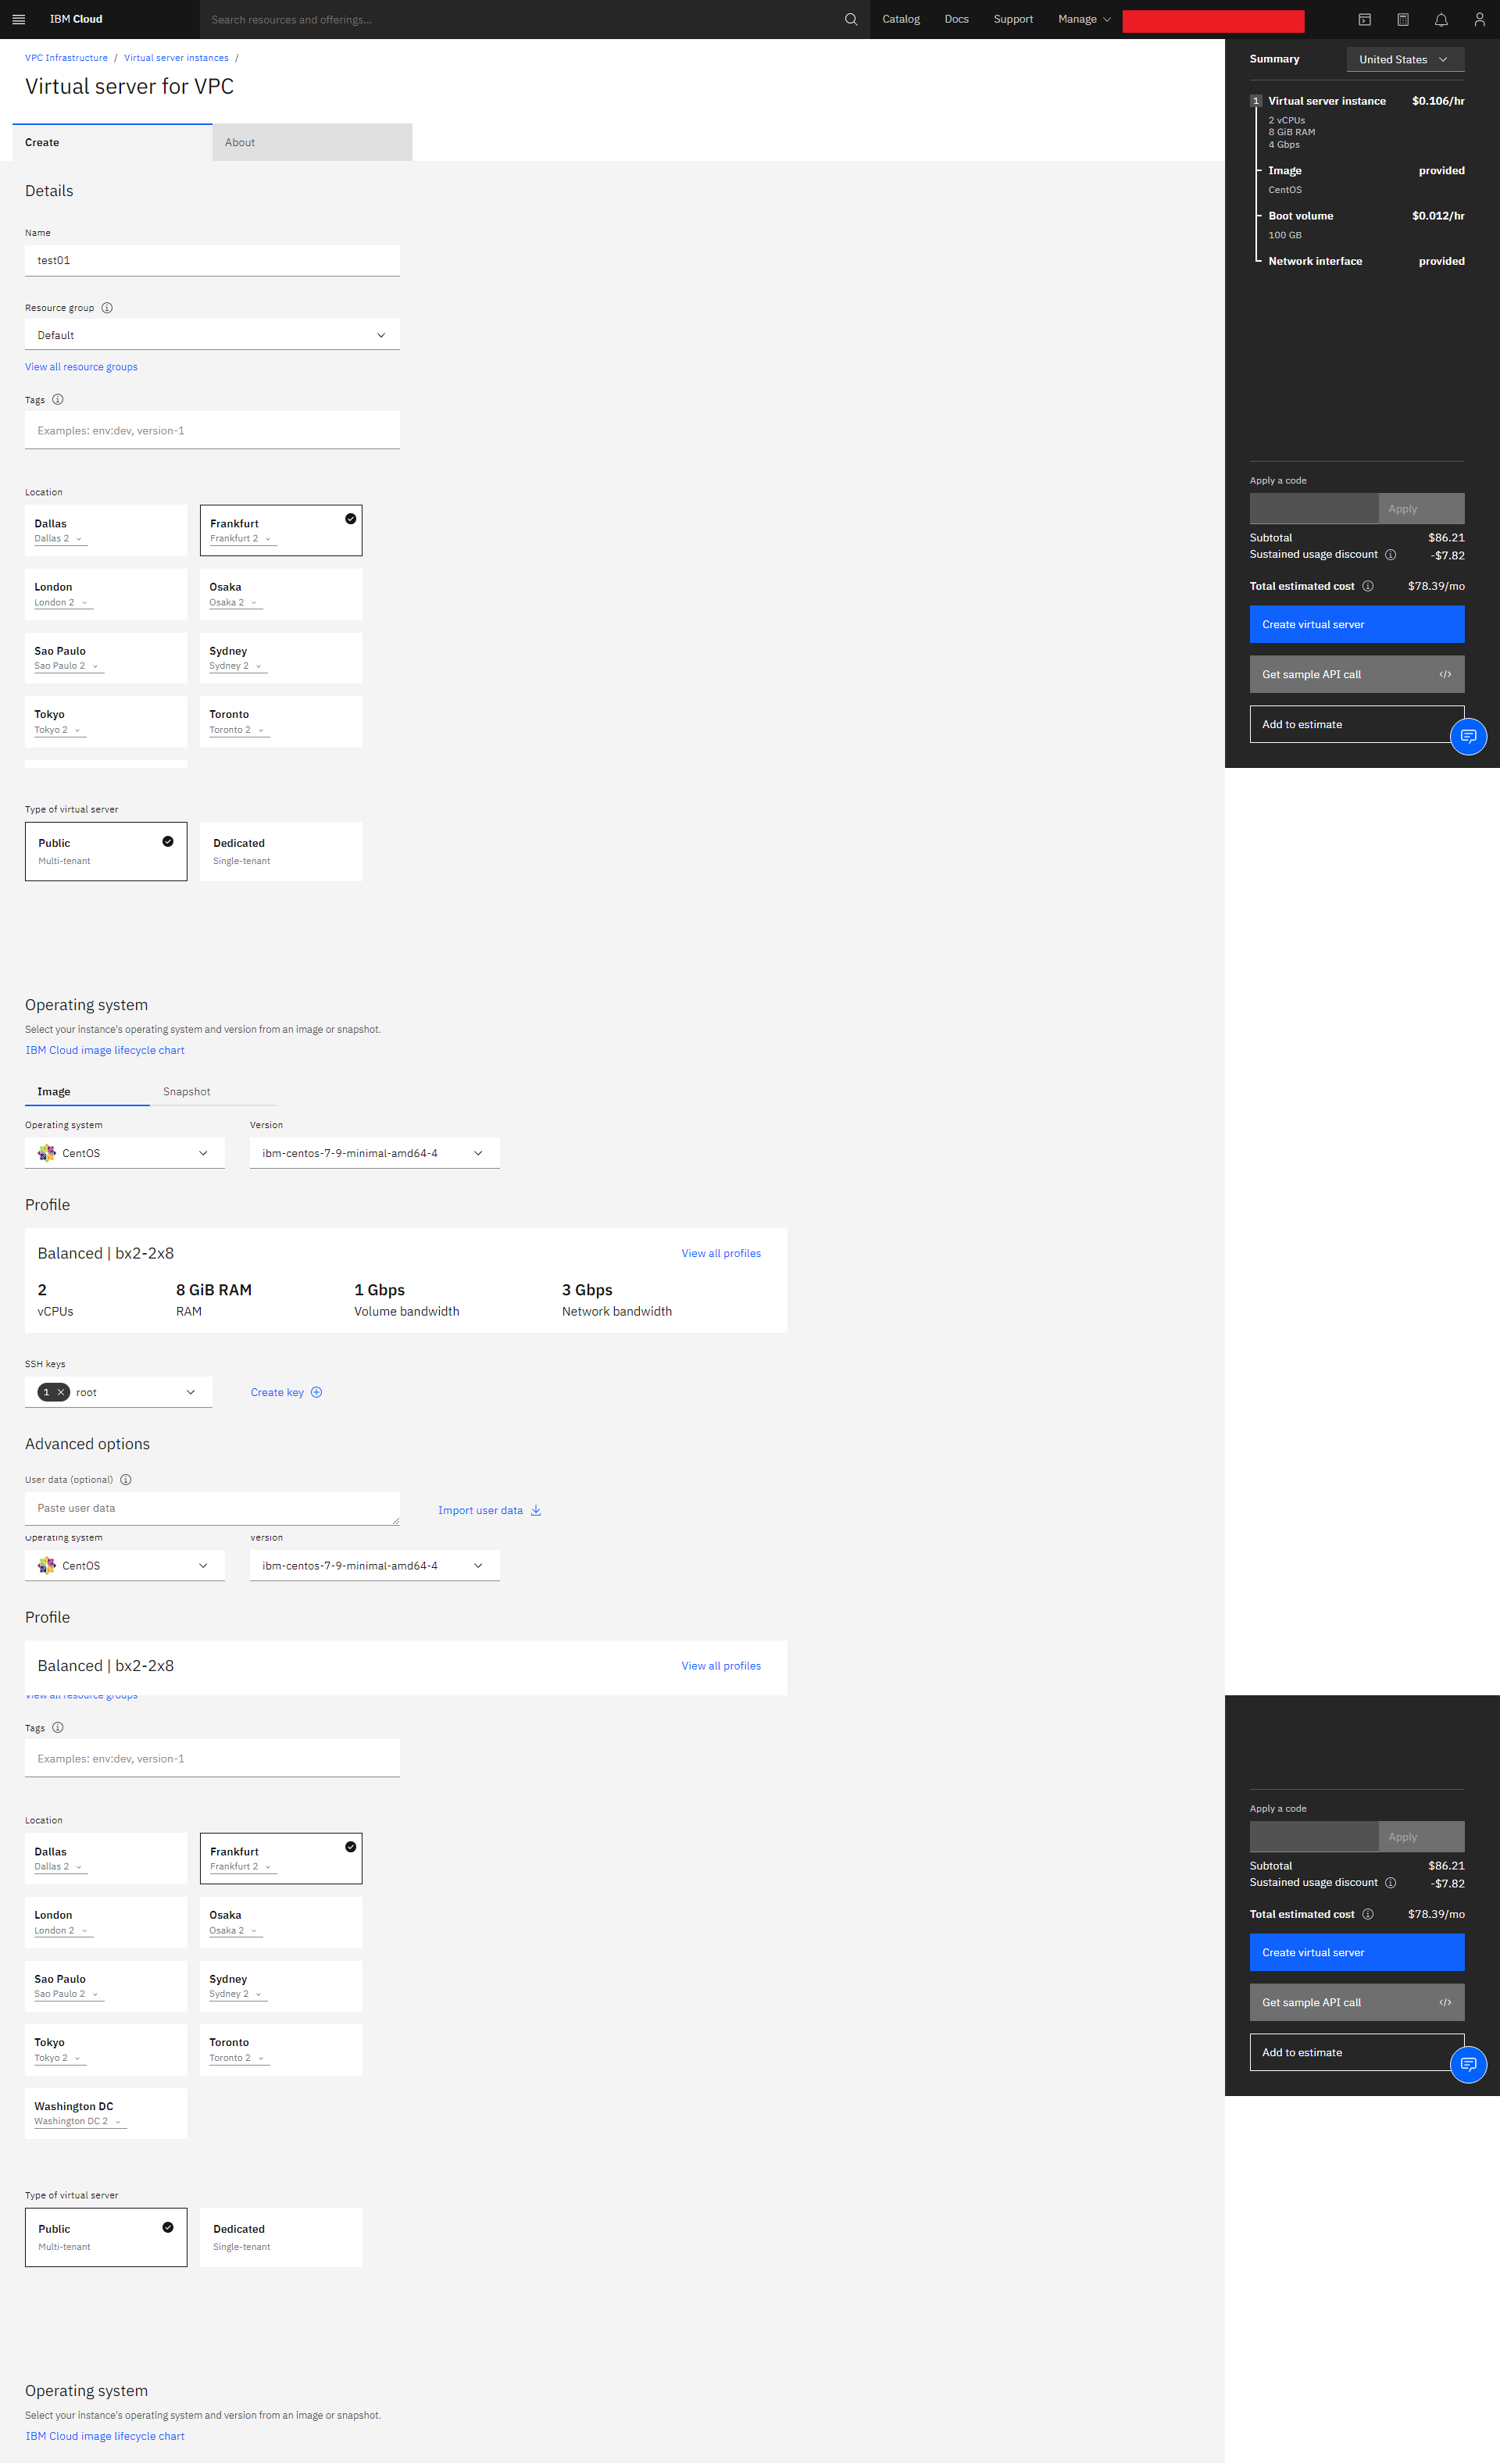
Navigate to VPC Infrastructure -> Virtual server instances and click on Create

Add the name of you choice and select the ssh keys you have created previously, then click Create virtual Server.

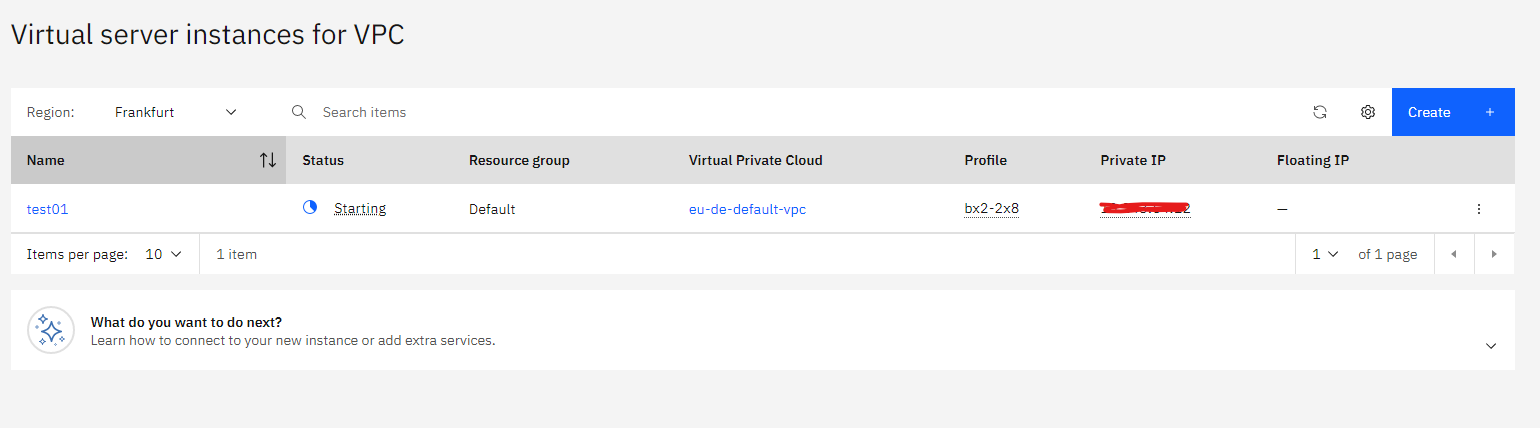
Your virtual server is now created. The vm will only have a Private IP.

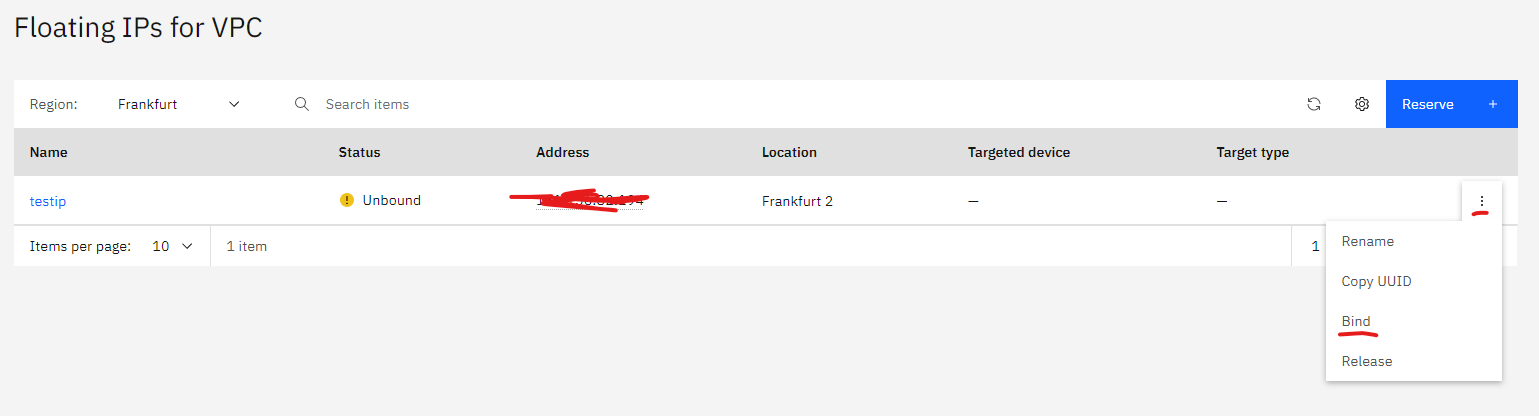
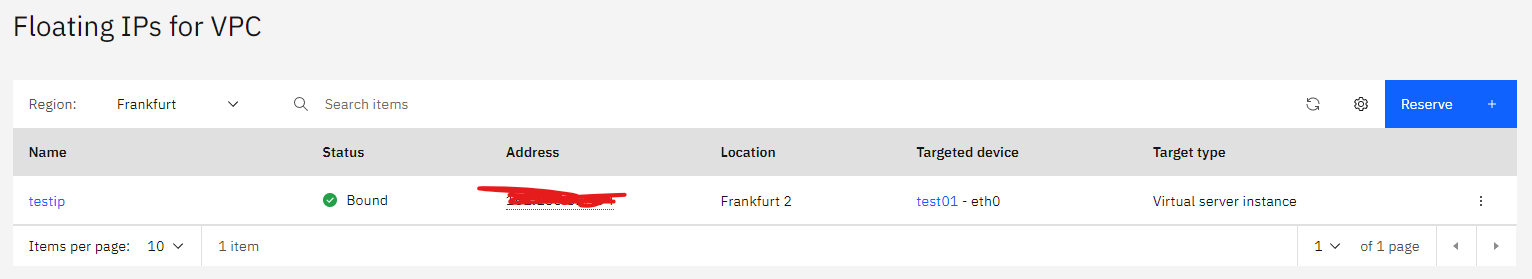
Navigate to VPC Infrastructure -> Floating IPs, right click on the drop down menu and select Bind.

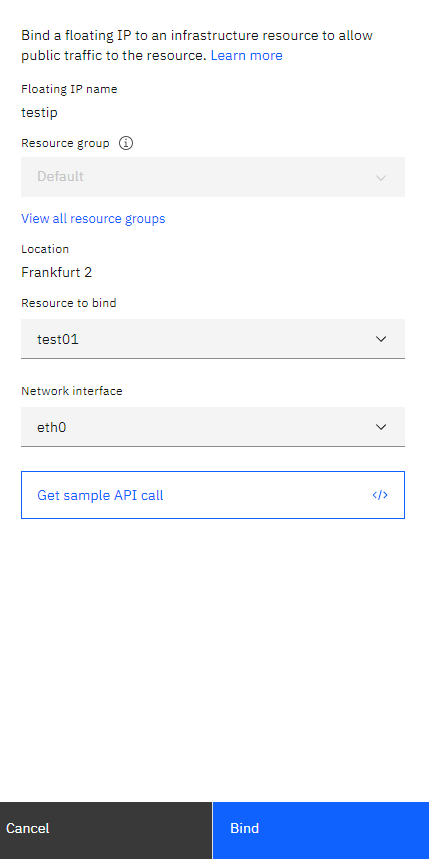
Select the VM instance you have created at Resource to bind then click Bind.

The status is now greened out showing Bound and the Targeted device should show your vm.

Log into the server using ssh from an other linux server or desktop using the following command:

ssh -i root root@xxx.xxx.xxx.xxx <- Floating ip

after the -i you have to specify the private key filename which is in our case is root.

root@localhost:/app# ssh -i root root@xxx.xxx.xxx.xxx
The authenticity of host ' xxx.xxx.xxx.xxx ( xxx.xxx.xxx.xxx )' can't be established.
ECDSA key fingerprint is SHA256:+wb+ApkNLds5hup2vMWEuvUSoabXppaG1ZCh0FzLrVw.
Are you sure you want to continue connecting (yes/no/[fingerprint])? yes
Warning: Permanently added ' xxx.xxx.xxx.xxx ' (ECDSA) to the list of known hosts.
Enter passphrase for key 'root':
[root@test01 ~]#

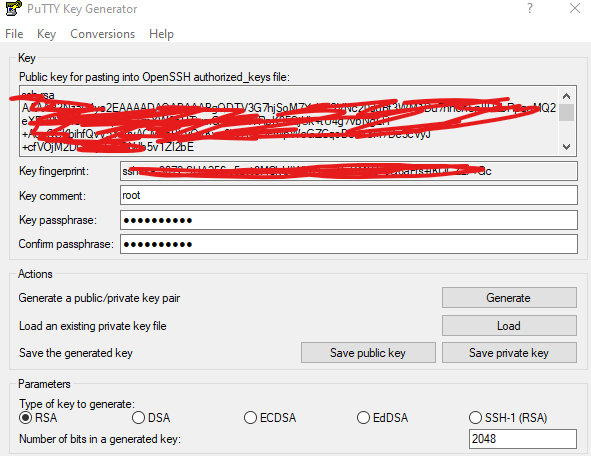
If you would like to use putty to log in from windows then the private key will likely to be incompatible so you will have to use the puttygen utility to load and save the private key in the proper format.

Open the puttygen utility and load your private key. Once loaded click on Save private key and you will get a putty compatible .pkk file.

Open putty, create the session, navigate to the Connection -> SSH -> Auth menu. Click Browse and open the newly generated pkk file then click Open to start the putty session.

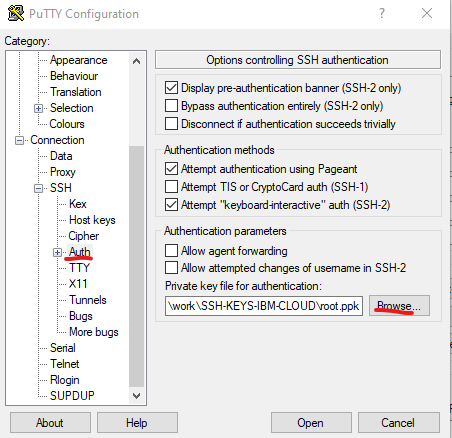
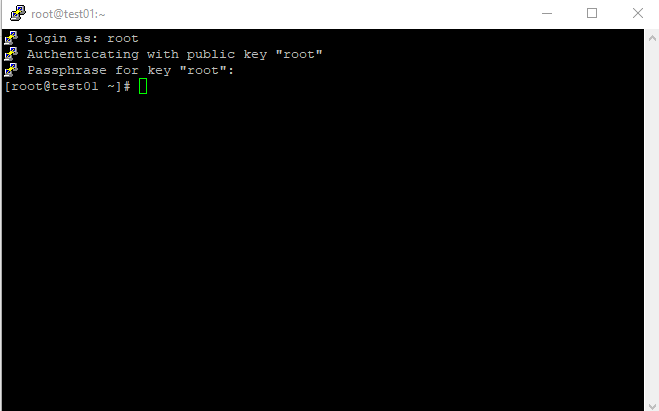
The putty session will now open to the server.

Alternative ways to log in to your server

Once you are logged in you can set the root password using the passwd command and you no longer need to have your server on a public ip address.

Feel free to unbind the Floating IP and use it for a different server or just simply delete it.

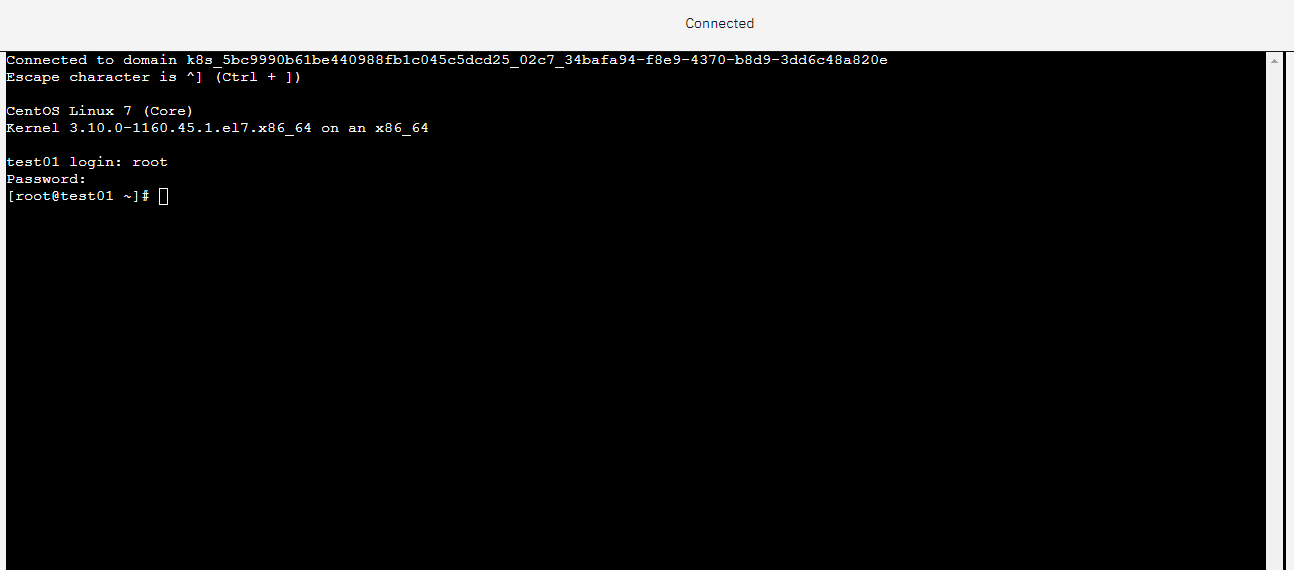
Navigate to VPC Infrastructure -> Virtual server instances and click on your VM. once you are in the main screen of your vm, select Actions on the top right corner and pick either Open VNC console or Open serial console.

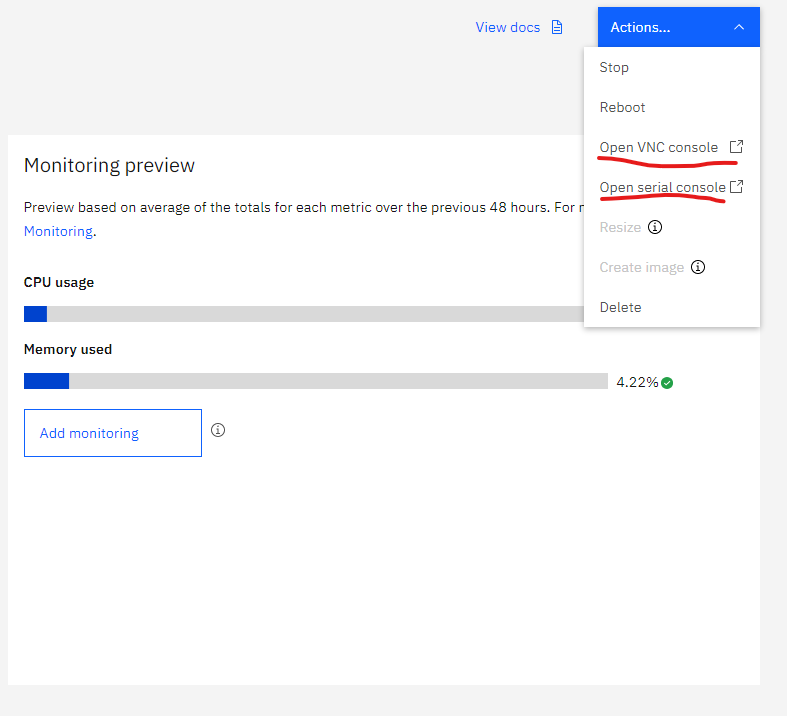
This will open a console to your vm without the need of a public ip address. Use your new password for root to log in.

Use binlog_expire_logs_seconds to purge mysql binary logs automatically

OS: Ubuntu 20

Mysql Version: 8+

We ran into this issue several times that on a high performance mysql server the binary files kept filling up the filesystem. Previously we did the purge manually with the following command from the mysql cli:

PURGE BINARY LOGS BEFORE NOW();

Then we did a bit of research on how to do this automatically and we found the binlog_expire_logs_seconds variable which is located in the /etc/mysql/mysql.conf.d/mysqld.cnf file. So adding the following line…

binlog_expire_logs_seconds = 259200

…will keep only 3 days worth of bin logs. Don’t forget to restart the mysql sevice using…

service mysql restart

…before the changes take effect.

How to gain root access to a pod on OpenShift

By default you do not have root access on any of the pods created on Openshift. If you still need root access for development or other purposes follow these simple steps to gain root:

Log in to your bastion box and switch project to the one you would like to work with:

oc project projectname

Create a service account that resembles the name of the project. We installed a zabbix container hence I used zabbix in the name.

oc create sa zabbix-nfs-sa

Give the service account privileged access.

oc adm policy add-scc-to-user privileged -z zabbix-nfs-sa

Now add the following to the relevant Deployment Config yaml. Remember you won’t be able to change this on a running pod.

The securityContext should be present with the default value of {}. You can replace that with the definition above.

The serviceAccountName and ServiceAccount are not present with the yaml file so you can add them right under or above the securityContext definition.

Once you have edited the yaml file, save it and it will automatically get updated on the pod.

If everything goes fine you should see this when you navigate to the terminal tab of your POD:

How to find out the Magento 2 store id using the backend

When you manage multiple store instances from Magento 2 sometimes you will need the specific store id of one store, especially if you would like to manipulate data by accessing the database directly.

One might ask why not use the methods provided by Magento2, the answer is simply they are way too slow to manage a store with over 1000 products effectively. Since we have 20K+ products it was necessary to change/manipulate data directly in the database across a huge, enterprise level,multi store environment.

So back to the original topic, the easiest way to find out your store id is

  • Log in to the Magento2 backend
  • Navigate to Stores->(Settings)->Configuration
  • From the store selector menu ( Scope, upper left corner ) select the store you would like to see the store if for
  • Have a look at the very end of the url in your browser and you will see something like: …/section/general/store/6/
  • The number in that URL will tell you what is the store id for the shop you picked from the store selector menu.

Where is Magento 2’s default default contact form located?

I have recently ran into an issue that I had to change the Magento 2’s default contact form for my websites due to google’s request.

I have found a lot of articles stating that the contact form will be among your blocks or pages. My contact form’s url is “contact” and I couldn’t find it in blocks nor in pages. I did some research and finally I figured that there was no option for me to change this from the back-end rather I had to go and look for a file that has this information on my server’s filesystem.

After some research I found that the file containing the Default Magento 2 contact form is called form.phtml and it is located in /vendor/magento/module-contact/view/frontend/templates/ directory on your server. You can add HTML code of your choice to this file, once updated it refreshes straight away even if you use extensive caching like I do.

mariadb.service: Start operation timed out. Terminating.

We performed housekeeping on our Zabbix instance and by the morning the whole system became unresponsive and even though multiple restarts the database kept hanging. Using the following command: journalctl -u mariadb.service we managed to pull this information.

Feb 05 04:09:07 bezabbix001 mysqld[4042]: 2020-02-05 4:09:07 139744107072640 [Note] /usr/sbin/mysqld (mysqld 10.1.43-MariaDB-0ubuntu0.18.04.1) starting as process 4042 …
Feb 05 04:09:07 bezabbix001 mysqld[4042]: 2020-02-05 4:09:07 139744107072640 [Warning] Could not increase number of max_open_files to more than 16364 (request: 20115)
Feb 05 04:10:37 bezabbix001 systemd[1]: mariadb.service: Start operation timed out. Terminating.
Feb 05 04:12:07 bezabbix001 systemd[1]: mariadb.service: State 'stop-sigterm' timed out. Skipping SIGKILL.
Feb 05 04:13:37 bezabbix001 systemd[1]: mariadb.service: State 'stop-final-sigterm' timed out. Skipping SIGKILL. Entering failed mode.
Feb 05 04:13:37 bezabbix001 systemd[1]: mariadb.service: Failed with result 'timeout'.
Feb 05 04:13:37 bezabbix001 systemd[1]: Failed to start MariaDB 10.1.43 database server.

The first issue indicated insufficient number of open files. The solution to this issue was to increase those numbers by setting the following in the /lib/systemd/system/mariadb.service file.

LimitNOFILE=200000
LimitMEMLOCK=200000

Once we set the setting above and run reload with the following command the Warning message went away.

sudo systemctl daemon-reload

The server however still wasn’t willing to start showing the following in the log:

Feb 05 04:28:19 bezabbix001 mysqld[4932]: 2020-02-05 4:28:19 140431509490816 [Note] /usr/sbin/mysqld (mysqld 10.1.43-MariaDB-0ubuntu0.18.04.1) starting as process 4932 …
Feb 05 04:29:49 bezabbix001 systemd[1]: mariadb.service: Start operation timed out. Terminating.
Feb 05 04:31:19 bezabbix001 systemd[1]: mariadb.service: State 'stop-sigterm' timed out. Skipping SIGKILL.
Feb 05 04:32:49 bezabbix001 systemd[1]: mariadb.service: State 'stop-final-sigterm' timed out. Skipping SIGKILL. Entering failed mode.
Feb 05 04:32:49 bezabbix001 systemd[1]: mariadb.service: Failed with result 'timeout'.
Feb 05 04:32:49 bezabbix001 systemd[1]: Failed to start MariaDB 10.1.43 database server.
Feb 05 04:34:20 bezabbix001 systemd[1]: mariadb.service: Got notification message from PID 4932, but reception only permitted for main PID which is currently not known
Feb 05 04:34:22 bezabbix001 systemd[1]: mariadb.service: Got notification message from PID 4932, but reception only permitted for main PID which is currently not known

This indicated that the service didn’t start within the default 90 seconds however it came up later. Since it has been timed out by service control already once the server came up it was immediately shut down. Looking at the /var/www/mysql/error.log which is the error log for maridb/mysql, we found that the server was just busy processing data and the startup was taking much longer than 90 seconds.

2020-02-05 4:39:55 140524339281024 [Note] InnoDB: Using mutexes to ref count buffer pool pages
2020-02-05 4:39:55 140524339281024 [Note] InnoDB: The InnoDB memory heap is disabled
2020-02-05 4:39:55 140524339281024 [Note] InnoDB: Mutexes and rw_locks use GCC atomic builtins
2020-02-05 4:39:55 140524339281024 [Note] InnoDB: GCC builtin __atomic_thread_fence() is used for memory barrier
2020-02-05 4:39:55 140524339281024 [Note] InnoDB: Compressed tables use zlib 1.2.11
2020-02-05 4:39:55 140524339281024 [Note] InnoDB: Using Linux native AIO
2020-02-05 4:39:55 140524339281024 [Note] InnoDB: Using SSE crc32 instructions
2020-02-05 4:39:55 140524339281024 [Note] InnoDB: Initializing buffer pool, size = 3.0G
2020-02-05 4:39:55 140524339281024 [Note] InnoDB: Completed initialization of buffer pool
2020-02-05 4:39:55 140524339281024 [Note] InnoDB: Highest supported file format is Barracuda.
InnoDB: 1 transaction(s) which must be rolled back or cleaned up
InnoDB: in total 86545366 row operations to undo
InnoDB: Trx id counter is 311544320
2020-02-05 4:54:54 140524339281024 [Note] InnoDB: 128 rollback segment(s) are active.
2020-02-05 4:54:54 140520315680512 [Note] InnoDB: Starting in background the rollback of recovered transactions
2020-02-05 4:54:54 140520315680512 [Note] InnoDB: To roll back: 1 transactions, 86545366 rows
2020-02-05 4:54:54 140524339281024 [Note] InnoDB: Percona XtraDB (http://www.percona.com) 5.6.45-86.1 started; log sequence number 376642022837
2020-02-05 4:54:54 140520315680512 [Warning] InnoDB: Difficult to find free blocks in the buffer pool (21 search iterations)! 0 failed attempts to flush a page!
2020-02-05 4:54:54 140520315680512 [Note] InnoDB: Consider increasing the buffer pool size.
2020-02-05 4:54:54 140520315680512 [Note] InnoDB: Pending flushes (fsync) log: 0 buffer pool: 1 OS file reads: 341095 OS file writes: 3 OS fsyncs: 2
2020-02-05 4:54:55 140520240146176 [Note] InnoDB: Dumping buffer pool(s) not yet started
2020-02-05 4:54:55 140524339281024 [Note] Plugin 'FEEDBACK' is disabled.
2020-02-05 4:54:55 140524339281024 [Note] Server socket created on IP: '0.0.0.0'.
2020-02-05 4:54:55 140524338853632 [Note] /usr/sbin/mysqld: Normal shutdown
2020-02-05 4:54:56 140524339281024 [Note] /usr/sbin/mysqld: ready for connections.
Version: '10.1.43-MariaDB-0ubuntu0.18.04.1' socket: '/var/run/mysqld/mysqld.sock' port: 3306 Ubuntu 18.04
2020-02-05 4:54:56 140524338853632 [Note] Event Scheduler: Purging the queue. 0 events
2020-02-05 4:54:56 140520273716992 [Note] InnoDB: FTS optimize thread exiting.
2020-02-05 4:54:56 140524338853632 [Note] InnoDB: Starting shutdown…
2020-02-05 4:54:56 140524338853632 [Note] InnoDB: Waiting for page_cleaner to finish flushing of buffer pool
2020-02-05 4:54:58 140524338853632 [Note] InnoDB: Shutdown completed; log sequence number 376642023203
2020-02-05 4:54:58 140524338853632 [Note] /usr/sbin/mysqld: Shutdown complete

The following settings were added to the /lib/systemd/system/mariadb.service file to increase service start and stop timeout.

TimeoutStartSec=infinity
TimeoutStopSec=infinity

Run reload to apply these settings:

sudo systemctl daemon-reload

The mariadb server slowly but finally started after increasing the timeout.

2020-02-05 5:12:06 139656180632704 [Note] InnoDB: Using mutexes to ref count buffer pool pages
2020-02-05 5:12:06 139656180632704 [Note] InnoDB: The InnoDB memory heap is disabled
2020-02-05 5:12:06 139656180632704 [Note] InnoDB: Mutexes and rw_locks use GCC atomic builtins
2020-02-05 5:12:06 139656180632704 [Note] InnoDB: GCC builtin __atomic_thread_fence() is used for memory barrier
2020-02-05 5:12:06 139656180632704 [Note] InnoDB: Compressed tables use zlib 1.2.11
2020-02-05 5:12:06 139656180632704 [Note] InnoDB: Using Linux native AIO
2020-02-05 5:12:06 139656180632704 [Note] InnoDB: Using SSE crc32 instructions
2020-02-05 5:12:06 139656180632704 [Note] InnoDB: Initializing buffer pool, size = 5.0G
2020-02-05 5:12:06 139656180632704 [Note] InnoDB: Completed initialization of buffer pool
2020-02-05 5:12:06 139656180632704 [Note] InnoDB: Highest supported file format is Barracuda.
InnoDB: 1 transaction(s) which must be rolled back or cleaned up
InnoDB: in total 86545366 row operations to undo
InnoDB: Trx id counter is 311544832
2020-02-05 5:25:38 139656180632704 [Note] InnoDB: 128 rollback segment(s) are active.
2020-02-05 5:25:38 139649825634048 [Note] InnoDB: Starting in background the rollback of recovered transactions
2020-02-05 5:25:38 139649825634048 [Note] InnoDB: To roll back: 1 transactions, 86545366 rows
2020-02-05 5:25:38 139656180632704 [Note] InnoDB: Waiting for purge to start
2020-02-05 5:25:38 139656180632704 [Note] InnoDB: Percona XtraDB (http://www.percona.com) 5.6.45-86.1 started; log sequence number 376642023203
2020-02-05 5:25:38 139649825634048 [Warning] InnoDB: Difficult to find free blocks in the buffer pool (21 search iterations)! 0 failed attempts to flush a page!
2020-02-05 5:25:38 139649825634048 [Note] InnoDB: Consider increasing the buffer pool size.
2020-02-05 5:25:38 139649825634048 [Note] InnoDB: Pending flushes (fsync) log: 1 buffer pool: 0 OS file reads: 341115 OS file writes: 5 OS fsyncs: 4
2020-02-05 5:25:39 139649750099712 [Note] InnoDB: Dumping buffer pool(s) not yet started
2020-02-05 5:25:39 139656180632704 [Note] Plugin 'FEEDBACK' is disabled.
2020-02-05 5:25:39 139656180632704 [Note] Server socket created on IP: '0.0.0.0'.
2020-02-05 5:25:40 139656180632704 [Note] /usr/sbin/mysqld: ready for connections.
Version: '10.1.43-MariaDB-0ubuntu0.18.04.1' socket: '/var/run/mysqld/mysqld.sock' port: 3306 Ubuntu 18.04
2020-02-05 5:25:53 139649825634048 [Note] InnoDB: To roll back: 1 transactions, 86544705 rows
2020-02-05 5:26:08 139649825634048 [Note] InnoDB: To roll back: 1 transactions, 86543690 rows
2020-02-05 5:26:23 139649825634048 [Note] InnoDB: To roll back: 1 transactions, 86464992 rows
2020-02-05 5:26:38 139649825634048 [Note] InnoDB: To roll back: 1 transactions, 85968784 rows
2020-02-05 5:26:53 139649825634048 [Note] InnoDB: To roll back: 1 transactions, 85674936 rows
2020-02-05 5:27:08 139649825634048 [Note] InnoDB: To roll back: 1 transactions, 85274020 rows

Magento 2.3.3 indexer stuck at reindexing

We have recently added 13K products to our Magento 2 based store. When we tried to run the reindexing process the indexer kept being stuck half way and our store became unreachable. We had to restart mariadb and run the indexer again to complete the reindexing successfully. Since we have a number of jobs running during the night including reindexing we had to find out why this is happening.

After reading up on the problem it became clear that it is some kind of a resource issue. We tried running the reindexing process granting 4G ram for the php process that runs the indexing but the issue was still the same. The command we used was:

php -d memory_limit=4G bin/magento indexer:reindex

After checking magento’s system.log we found the following warnings:

[2020-01-18 09:39:36] main.WARNING: Memory size allocated for the temporary table is more than 20% of innodb_buffer_pool_size. Please update innodb_buffer_pool_size or decrease batch size value (which decreases memory usages for the temporary table). Current batch size: 100000; Allocated memory size: 600000000 bytes; InnoDB buffer pool size: 134217728 bytes. [] []
[2020-01-18 09:39:37] main.WARNING: Memory size allocated for the temporary table is more than 20% of innodb_buffer_pool_size. Please update innodb_buffer_pool_size or decrease batch size value (which decreases memory usages for the temporary table). Current batch size: 100000; Allocated memory size: 600000000 bytes; InnoDB buffer pool size: 134217728 bytes. [] []
[2020-01-18 09:39:38] main.WARNING: Memory size allocated for the temporary table is more than 20% of innodb_buffer_pool_size. Please update innodb_buffer_pool_size or decrease batch size value (which decreases memory usages for the temporary table). Current batch size: 100000; Allocated memory size: 600000000 bytes; InnoDB buffer pool size: 134217728 bytes. [] []
[2020-01-18 09:39:38] main.WARNING: Memory size allocated for the temporary table is more than 20% of innodb_buffer_pool_size. Please update innodb_buffer_pool_size or decrease batch size value (which decreases memory usages for the temporary table). Current batch size: 100000; Allocated memory size: 600000000 bytes; InnoDB buffer pool size: 134217728 bytes. [] []
[2020-01-18 09:39:38] main.WARNING: Memory size allocated for the temporary table is more than 20% of innodb_buffer_pool_size. Please update innodb_buffer_pool_size or decrease batch size value (which decreases memory usages for the temporary table). Current batch size: 100000; Allocated memory size: 600000000 bytes; InnoDB buffer pool size: 134217728 bytes. [] []
[2020-01-18 09:39:38] main.WARNING: Memory size allocated for the temporary table is more than 20% of innodb_buffer_pool_size. Please update innodb_buffer_pool_size or decrease batch size value (which decreases memory usages for the temporary table). Current batch size: 100000; Allocated memory size: 600000000 bytes; InnoDB buffer pool size: 134217728 bytes. [] []
[2020-01-18 09:39:39] main.WARNING: Memory size allocated for the temporary table is more than 20% of innodb_buffer_pool_size. Please update innodb_buffer_pool_size or decrease batch size value (which decreases memory usages for the temporary table). Current batch size: 100000; Allocated memory size: 600000000 bytes; InnoDB buffer pool size: 134217728 bytes. [] []
[2020-01-18 09:39:44] main.WARNING: Memory size allocated for the temporary table is more than 20% of innodb_buffer_pool_size. Please update innodb_buffer_pool_size or decrease batch size value (which decreases memory usages for the temporary table). Current batch size: 100000; Allocated memory size: 600000000 bytes; InnoDB buffer pool size: 134217728 bytes. [] []
[2020-01-18 09:39:48] main.WARNING: Memory size allocated for the temporary table is more than 20% of innodb_buffer_pool_size. Please update innodb_buffer_pool_size or decrease batch size value (which decreases memory usages for the temporary table). Current batch size: 1000; Allocated memory size: 32500000 bytes; InnoDB buffer pool size: 134217728 bytes. [] []

After reading up on this issue we added the following parameter to the maridb’s 50-server.cnf configration file under the [mysqld] section:

innodb_buffer_pool_size=3G

If you use mysql instead of mariadb the file you need to modify is my.cnf.

UPDATE: This didn’t solve the issue permanently we also had to change settings in vendor/magento/module-catalog/etc/di.xml file. batchRowsCount in Magento\Catalog\Model\ResourceModel\Product\Indexer\Price\BatchSizeCalculator to 1000

<preference for="Magento\Catalog\Pricing\Price\MinimalPriceCalculatorInterface" type="Magento\Catalog\Pricing\Price\MinimalTierPriceCalculator" />
<type name="Magento\Catalog\Model\ResourceModel\Product\Indexer\Price\BatchSizeCalculator">
    <arguments>
        <argument name="batchRowsCount" xsi:type="array">
            <item name="default" xsi:type="number">1000</item>
        </argument>
        <argument name="estimators" xsi:type="array">
            <item name="default" xsi:type="object">Magento\Catalog\Model\Indexer\Price\BatchSizeManagement</item>
        </argument>
    </arguments>
</type>

..and the batchRowsCount in Magento\Catalog\Model\Indexer\Category\Product\Action\Full to 10000

   <type name="Magento\Catalog\Model\Indexer\Category\Product\Action\Full">
        <arguments>
            <argument name="batchRowsCount" xsi:type="number">10000</argument>
            <argument name="batchSizeManagement" xsi:type="object">Magento\Catalog\Model\Indexer\CategoryProductBatchSize</argument>
        </arguments>
    </type>

These settings reduce the batch size for the indexer making it lighter on server’s resources. Let’s see how it goes now.

Allowed memory size of 792723456 bytes exhausted at Magento 2 extension installation

When you install a fresh Magento 2 system, you might encounter a nasty error when you would like to install additional extensions for your magento 2 setup. The error shows on the Magento console first:

Check Component Dependency. We found conflicting component dependencies.

In my case this error was related to the fact that the system has run out of memory while it was checking the component dependencies. The Apache error log contained the following:

[Thu Aug 15 17:21:35.703406 2019] [php7:error] [pid 5918] [client 192.168.0.101:63386] PHP Fatal error:  Allowed memory size of 792723456 bytes exhausted (tried to allocate 4096 bytes) in /var/www/html/vendor/composer/composer/src/Composer/DependencyResolver/RuleSetGenerator.php on line 129, referer: http://192.168.0.85/setup/

[Thu Aug 15 17:21:35.712310 2019] [php7:error] [pid 5918] [client 192.168.0.101:63386] PHP Fatal error:  Allowed memory size of 792723456 bytes exhausted (tried to allocate 45056 bytes) in /var/www/html/vendor/magento/framework/Session/SessionManager.php on line 150, referer: http://192.168.0.85/setup/

[Thu Aug 15 17:21:35.723690 2019] [php7:error] [pid 5924] [client 192.168.0.101:63388] PHP Fatal error:  Uncaught Exception: Warning: session_start(): Failed to decode session object. Session has been destroyed in /var/www/html/vendor/magento/framework/Session/SessionManager.php on line 206 in /var/www/html/vendor/magento/framework/App/ErrorHandler.php:61\nStack trace:\n#0 [internal function]: Magento\\Framework\\App\\ErrorHandler->handler(2, 'session_start()...', '/var/www/html/v...', 206, Array)\n#1 /var/www/html/vendor/magento/framework/Session/SessionManager.php(206): session_start()\n#2 /var/www/html/generated/code/Magento/Backend/Model/Auth/Session/Interceptor.php(167): Magento\\Framework\\Session\\SessionManager->start()\n#3 /var/www/html/vendor/magento/framework/Session/SessionManager.php(140): Magento\\Backend\\Model\\Auth\\Session\\Interceptor->start()\n#4 /var/www/html/vendor/magento/module-backend/Model/Auth/Session.php(101): Magento\\Framework\\Session\\SessionManager->__construct(Object(Magento\\Framework\\App\\Request\\Http), Object(Magento\\Framework\\Session\\SidResolver\\Proxy), Object(Magento\\Backend\\Model\\Session\\AdminC in /var/www/html/vendor/magento/framework/App/ErrorHandler.php on line 61, referer: http://192.168.0.85/setup/

[Thu Aug 15 17:21:35.726328 2019] [php7:error] [pid 6010] [client 192.168.0.101:63389] PHP Fatal error:  Uncaught Exception: Warning: session_start(): Failed to decode session object. Session has been destroyed in /var/www/html/vendor/magento/framework/Session/SessionManager.php on line 206 in /var/www/html/vendor/magento/framework/App/ErrorHandler.php:61\nStack trace:\n#0 [internal function]: Magento\\Framework\\App\\ErrorHandler->handler(2, 'session_start()...', '/var/www/html/v...', 206, Array)\n#1 /var/www/html/vendor/magento/framework/Session/SessionManager.php(206): session_start()\n#2 /var/www/html/generated/code/Magento/Backend/Model/Auth/Session/Interceptor.php(167): Magento\\Framework\\Session\\SessionManager->start()\n#3 /var/www/html/vendor/magento/framework/Session/SessionManager.php(140): Magento\\Backend\\Model\\Auth\\Session\\Interceptor->start()\n#4 /var/www/html/vendor/magento/module-backend/Model/Auth/Session.php(101): Magento\\Framework\\Session\\SessionManager->__construct(Object(Magento\\Framework\\App\\Request\\Http), Object(Magento\\Framework\\Session\\SidResolver\\Proxy), Object(Magento\\Backend\\Model\\Session\\AdminC in /var/www/html/vendor/magento/framework/App/ErrorHandler.php on line 61, referer: http://192.168.0.85/setup/

The solution to this issue is to raise the memory limits which would be an easy one if it wasn’t defined at least at 2 location.

First edit the relevant section of the php.ini make sure you are editing the one that is used by the apache2 server. If you are using ubuntu it is usually in the following location:

/etc/php/[version]/apache2/php.ini

Change the memory_limit variable to 2048M from 756M

memory_limit = 2048M

Then open the .htaccess file from your magento root directory and change the memory_limit variable to 2048M from 756M. Be aware that this parameter is defined TWICE in the .htaccess file so change the value in BOTH locations then restart the apache2 server

service apache2 restart

Create the phpinfo.php file in your magento root directory if you don’t already have it. Just create the file and paste the one line shown below in it, then save it.

Now go to your base server url plus the phpini.php file like:

http://192.168.0.85/phpinfo.php

Once the page is open navigate to the memory limit section and check if the settings have changed

The local and master value should both show 2048M.

This solution has solved my issue if you have less memory at your server you might want to experiment with gradually increasing the memory from 756M to 1024M, etc and see if it works with the new amount.

Install and Enable Splunk Add-On for Unix and Linux on a Splunk Forwarder

We assume that you have a splunk enteprise server installed and the Splunk Add-On for Unix addon downloaded and installed on the server side.

We now go ahead and install the same on an ubuntu 18.4.0 forwarder.

Upload the same package you used on your server for the installation onto the splunk forwarder. At the time of writing this file is splunk-add-on-for-unix-and-linux_602.tgz

Untar the file to a location of your choice:

tar -xvzf splunk-add-on-for-unix-and-linux_602.tgz

Copy the Splunk_TA_nix directory and its contents across to the splunk addons directory:

cp -R /app/images/splunk_linux/Splunk_TA_nix /opt/splunkforwarder/etc/apps

The default configuration file for the Splunk Add-On for Unix addon has all stanzas disabled. Edit the /opt/splunkforwarder/etc/apps/Splunk_TA_nix/default/inputs.conf configuration file and change the disabled = 1 sections to disabled = 0 at the stanzas you would like to get covered. We disabled the ps and top sections at the test environment as they were generating way too much traffic. We used the following inputs.conf:

Copyright (C) 2019 Splunk Inc. All Rights Reserved.
 [script://./bin/vmstat.sh]
 interval = 60
 sourcetype = vmstat
 source = vmstat
 disabled = 0
 [script://./bin/iostat.sh]
 interval = 60
 sourcetype = iostat
 source = iostat
 disabled = 0
 [script://./bin/nfsiostat.sh]
 interval = 60
 sourcetype = nfsiostat
 source = nfsiostat
 disabled = 0
 [script://./bin/ps.sh]
 interval = 30
 sourcetype = ps
 source = ps
 disabled = 1
 [script://./bin/top.sh]
 interval = 60
 sourcetype = top
 source = top
 disabled = 1
 [script://./bin/netstat.sh]
 interval = 60
 sourcetype = netstat
 source = netstat
 disabled = 0
 [script://./bin/bandwidth.sh]
 interval = 60
 sourcetype = bandwidth
 source = bandwidth
 disabled = 0
 [script://./bin/protocol.sh]
 interval = 60
 sourcetype = protocol
 source = protocol
 disabled = 0
 [script://./bin/openPorts.sh]
 interval = 300
 sourcetype = openPorts
 source = openPorts
 disabled = 0
 [script://./bin/time.sh]
 interval = 21600
 sourcetype = time
 source = time
 disabled = 0
 [script://./bin/lsof.sh]
 interval = 600
 sourcetype = lsof
 source = lsof
 disabled = 0
 [script://./bin/df.sh]
 interval = 300
 sourcetype = df
 source = df
 disabled = 0
 Shows current user sessions
 [script://./bin/who.sh]
 sourcetype = who
 source = who
 interval = 150
 disabled = 0
 Lists users who could login (i.e., they are assigned a login shell)
 [script://./bin/usersWithLoginPrivs.sh]
 sourcetype = usersWithLoginPrivs
 source = usersWithLoginPrivs
 interval = 3600
 disabled = 0
 Shows last login time for users who have ever logged in
 [script://./bin/lastlog.sh]
 sourcetype = lastlog
 source = lastlog
 interval = 300
 disabled = 0
 Shows stats per link-level Etherner interface (simply, NIC)
 [script://./bin/interfaces.sh]
 sourcetype = interfaces
 source = interfaces
 interval = 60
 disabled = 0
 Shows stats per CPU (useful for SMP machines)
 [script://./bin/cpu.sh]
 sourcetype = cpu
 source = cpu
 interval = 30
 disabled = 0
 This script reads the auditd logs translated with ausearch
 [script://./bin/rlog.sh]
 sourcetype = auditd
 source = auditd
 interval = 60
 disabled = 0
 Run package management tool collect installed packages
 [script://./bin/package.sh]
 sourcetype = package
 source = package
 interval = 3600
 disabled = 0
 [script://./bin/hardware.sh]
 sourcetype = hardware
 source = hardware
 interval = 36000
 disabled = 0
 [monitor:///Library/Logs]
 disabled = 1
 [monitor:///var/log]
 whitelist=(.log|log$|messages|secure|auth|mesg$|cron$|acpid$|.out)
 blacklist=(lastlog|anaconda.syslog)
 disabled = 1
 [monitor:///var/adm]
 whitelist=(.log|log$|messages)
 disabled = 0
 [monitor:///etc]
 whitelist=(.conf|.cfg|config$|.ini|.init|.cf|.cnf|shrc$|^ifcfg|.profile|.rc|.rules|.tab|tab$|.login|policy$)
 disabled = 1
 bash history
 [monitor:///root/.bash_history]
 disabled = true
 sourcetype = bash_history
 [monitor:///home/*/.bash_history]
 disabled = true
 sourcetype = bash_history
 Added for ES support
 Note that because the UNIX app uses a single script to retrieve information
 from multiple OS flavors, and is intended to run on Universal Forwarders,
 it is not possible to differentiate between OS flavors by assigning
 different sourcetypes for each OS flavor (e.g. Linux:SSHDConfig), as was
 the practice in the older deployment-apps included with ES. Instead,
 sourcetypes are prefixed with the generic "Unix".
 May require Splunk forwarder to run as root on some platforms.
 [script://./bin/openPortsEnhanced.sh]
 disabled = true
 interval = 3600
 source = Unix:ListeningPorts
 sourcetype = Unix:ListeningPorts
 [script://./bin/passwd.sh]
 disabled = true
 interval = 3600
 source = Unix:UserAccounts
 sourcetype = Unix:UserAccounts
 Only applicable to Linux
 [script://./bin/selinuxChecker.sh]
 disabled = true
 interval = 3600
 source = Linux:SELinuxConfig
 sourcetype = Linux:SELinuxConfig
 Currently only supports SunOS, Linux, OSX.
 May require Splunk forwarder to run as root on some platforms.
 [script://./bin/service.sh]
 disabled = true
 interval = 3600
 source = Unix:Service
 sourcetype = Unix:Service
 Currently only supports SunOS, Linux, OSX.
 May require Splunk forwarder to run as root on some platforms.
 [script://./bin/sshdChecker.sh]
 disabled = true
 interval = 3600
 source = Unix:SSHDConfig
 sourcetype = Unix:SSHDConfig
 Currently only supports Linux, OSX.
 May require Splunk forwarder to run as root on some platforms.
 [script://./bin/update.sh]
 disabled = true
 interval = 86400
 source = Unix:Update
 sourcetype = Unix:Update
 [script://./bin/uptime.sh]
 disabled = true
 interval = 86400
 source = Unix:Uptime
 sourcetype = Unix:Uptime
 [script://./bin/version.sh]
 disabled = true
 interval = 86400
 source = Unix:Version
 sourcetype = Unix:Version
 This script may need to be modified to point to the VSFTPD configuration file.
 [script://./bin/vsftpdChecker.sh]
 disabled = true
 interval = 86400
 source = Unix:VSFTPDConfig
 sourcetype = Unix:VSFTPDConfig

The last step is to restart the splunk forwarder:

/opt/splunkforwarder/bin/splunk restart

Now verify if the changes took place by running:

/opt/splunkforwarder/bin/splunk cmd btool inputs list

You should see all the Linux OS related monitoring options listed. Just like this:

[SSL]
 _rcvbuf = 1572864
 allowSslRenegotiation = true
 cipherSuite = ECDHE-ECDSA-AES256-GCM-SHA384:ECDHE-RSA-AES256-GCM-SHA384:ECDHE-ECDSA-AES128-GCM-SHA256:ECDHE-RSA-AES128-GCM-SHA256:ECDHE-ECDSA-AES256-SHA384:ECDHE-RSA-AES256-SHA384:ECDHE-ECDSA-AES128-SHA256:ECDHE-RSA-AES128-SHA256
 ecdhCurves = prime256v1, secp384r1, secp521r1
 host = zds.ztacs.com
 index = default
 sslQuietShutdown = false
 sslVersions = tls1.2
 [batch:///opt/splunkforwarder/var/run/splunk/search_telemetry/*search_telemetry.json]
 _rcvbuf = 1572864
 crcSalt = 

 host = zds.ztacs.com
 index = _introspection
 log_on_completion = 0
 move_policy = sinkhole
 sourcetype = search_telemetry
 [batch:///opt/splunkforwarder/var/spool/splunk]
 _rcvbuf = 1572864
 crcSalt = 

 host = zds.ztacs.com
 index = default
 move_policy = sinkhole
 [batch:///opt/splunkforwarder/var/spool/splunk/…stash_new]
 _rcvbuf = 1572864
 crcSalt = 

 host = zds.ztacs.com
 index = default
 move_policy = sinkhole
 queue = stashparsing
 sourcetype = stash_new
 [blacklist:/opt/splunkforwarder/etc/auth]
 _rcvbuf = 1572864
 host = zds.ztacs.com
 index = default
 [blacklist:/opt/splunkforwarder/etc/passwd]
 _rcvbuf = 1572864
 host = zds.ztacs.com
 index = default
 [fschange:/opt/splunkforwarder/etc]
 _rcvbuf = 1572864
 delayInMills = 100
 filesPerDelay = 10
 followLinks = false
 fullEvent = false
 hashMaxSize = -1
 host = zds.ztacs.com
 index = default
 pollPeriod = 600
 recurse = true
 sendEventMaxSize = -1
 signedaudit = true
 [http]
 _rcvbuf = 1572864
 allowSslCompression = true
 allowSslRenegotiation = true
 dedicatedIoThreads = 2
 disabled = 1
 enableSSL = 1
 host = zds.ztacs.com
 index = default
 maxSockets = 0
 maxThreads = 0
 port = 8088
 sslVersions = *,-ssl2
 useDeploymentServer = 0
 [monitor:///Library/Logs]
 _rcvbuf = 1572864
 disabled = 1
 host = zds.ztacs.com
 index = default
 [monitor:///etc]
 _rcvbuf = 1572864
 disabled = 1
 host = zds.ztacs.com
 index = default
 whitelist = (.conf|.cfg|config$|.ini|.init|.cf|.cnf|shrc$|^ifcfg|.profile|.rc|.rules|.tab|tab$|.login|policy$)
 [monitor:///home/*/.bash_history]
 _rcvbuf = 1572864
 disabled = true
 host = zds.ztacs.com
 index = default
 sourcetype = bash_history
 [monitor:///opt/splunkforwarder/etc/splunk.version]
 _TCP_ROUTING = *
 _rcvbuf = 1572864
 host = zds.ztacs.com
 index = _internal
 sourcetype = splunk_version
 [monitor:///opt/splunkforwarder/var/log/splunk]
 _rcvbuf = 1572864
 host = zds.ztacs.com
 index = _internal
 [monitor:///opt/splunkforwarder/var/log/splunk/license_usage_summary.log]
 _rcvbuf = 1572864
 host = zds.ztacs.com
 index = _telemetry
 [monitor:///opt/splunkforwarder/var/log/splunk/metrics.log]
 _TCP_ROUTING = *
 _rcvbuf = 1572864
 host = zds.ztacs.com
 index = _internal
 [monitor:///opt/splunkforwarder/var/log/splunk/splunkd.log]
 _TCP_ROUTING = *
 _rcvbuf = 1572864
 host = zds.ztacs.com
 index = _internal
 [monitor:///opt/splunkforwarder/var/log/watchdog/watchdog.log*]
 _rcvbuf = 1572864
 host = zds.ztacs.com
 index = _internal
 [monitor:///root/.bash_history]
 _rcvbuf = 1572864
 disabled = true
 host = zds.ztacs.com
 index = default
 sourcetype = bash_history
 [monitor:///var/adm]
 _rcvbuf = 1572864
 disabled = 0
 host = zds.ztacs.com
 index = default
 whitelist = (.log|log$|messages)
 [monitor:///var/log]
 _rcvbuf = 1572864
 blacklist = (lastlog|anaconda.syslog)
 disabled = 1
 host = zds.ztacs.com
 index = default
 whitelist = (.log|log$|messages|secure|auth|mesg$|cron$|acpid$|.out)
 [monitor:///var/log/apache2/zds_access.log]
 _rcvbuf = 1572864
 disabled = false
 host = zds.ztacs.com
 index = default
 sourcetype = access_log
 [monitor:///var/log/syslog]
 _rcvbuf = 1572864
 disabled = false
 host = zds.ztacs.com
 index = remotelogs
 sourcetype = linux_logs
 [script]
 _rcvbuf = 1572864
 host = zds.ztacs.com
 index = default
 interval = 60.0
 start_by_shell = true
 [script:///opt/splunkforwarder/etc/apps/Splunk_TA_nix/bin/bandwidth.sh]
 _rcvbuf = 1572864
 disabled = 0
 host = zds.ztacs.com
 index = default
 interval = 60
 source = bandwidth
 sourcetype = bandwidth
 [script:///opt/splunkforwarder/etc/apps/Splunk_TA_nix/bin/cpu.sh]
 _rcvbuf = 1572864
 disabled = 0
 host = zds.ztacs.com
 index = default
 interval = 30
 source = cpu
 sourcetype = cpu
 [script:///opt/splunkforwarder/etc/apps/Splunk_TA_nix/bin/df.sh]
 _rcvbuf = 1572864
 disabled = 0
 host = zds.ztacs.com
 index = default
 interval = 300
 source = df
 sourcetype = df
 [script:///opt/splunkforwarder/etc/apps/Splunk_TA_nix/bin/hardware.sh]
 _rcvbuf = 1572864
 disabled = 0
 host = zds.ztacs.com
 index = default
 interval = 36000
 source = hardware
 sourcetype = hardware
 [script:///opt/splunkforwarder/etc/apps/Splunk_TA_nix/bin/interfaces.sh]
 _rcvbuf = 1572864
 disabled = 0
 host = zds.ztacs.com
 index = default
 interval = 60
 source = interfaces
 sourcetype = interfaces
 [script:///opt/splunkforwarder/etc/apps/Splunk_TA_nix/bin/iostat.sh]
 _rcvbuf = 1572864
 disabled = 0
 host = zds.ztacs.com
 index = default
 interval = 60
 source = iostat
 sourcetype = iostat
 [script:///opt/splunkforwarder/etc/apps/Splunk_TA_nix/bin/lastlog.sh]
 _rcvbuf = 1572864
 disabled = 0
 host = zds.ztacs.com
 index = default
 interval = 300
 source = lastlog
 sourcetype = lastlog
 [script:///opt/splunkforwarder/etc/apps/Splunk_TA_nix/bin/lsof.sh]
 _rcvbuf = 1572864
 disabled = 0
 host = zds.ztacs.com
 index = default
 interval = 600
 source = lsof
 sourcetype = lsof
 [script:///opt/splunkforwarder/etc/apps/Splunk_TA_nix/bin/netstat.sh]
 _rcvbuf = 1572864
 disabled = 0
 host = zds.ztacs.com
 index = default
 interval = 60
 source = netstat
 sourcetype = netstat
 [script:///opt/splunkforwarder/etc/apps/Splunk_TA_nix/bin/nfsiostat.sh]
 _rcvbuf = 1572864
 disabled = 0
 host = zds.ztacs.com
 index = default
 interval = 60
 source = nfsiostat
 sourcetype = nfsiostat
 [script:///opt/splunkforwarder/etc/apps/Splunk_TA_nix/bin/openPorts.sh]
 _rcvbuf = 1572864
 disabled = 0
 host = zds.ztacs.com
 index = default
 interval = 300
 source = openPorts
 sourcetype = openPorts
 [script:///opt/splunkforwarder/etc/apps/Splunk_TA_nix/bin/openPortsEnhanced.sh]
 _rcvbuf = 1572864
 disabled = true
 host = zds.ztacs.com
 index = default
 interval = 3600
 source = Unix:ListeningPorts
 sourcetype = Unix:ListeningPorts
 [script:///opt/splunkforwarder/etc/apps/Splunk_TA_nix/bin/package.sh]
 _rcvbuf = 1572864
 disabled = 0
 host = zds.ztacs.com
 index = default
 interval = 3600
 source = package
 sourcetype = package
 [script:///opt/splunkforwarder/etc/apps/Splunk_TA_nix/bin/passwd.sh]
 _rcvbuf = 1572864
 disabled = true
 host = zds.ztacs.com
 index = default
 interval = 3600
 source = Unix:UserAccounts
 sourcetype = Unix:UserAccounts
 [script:///opt/splunkforwarder/etc/apps/Splunk_TA_nix/bin/protocol.sh]
 _rcvbuf = 1572864
 disabled = 0
 host = zds.ztacs.com
 index = default
 interval = 60
 source = protocol
 sourcetype = protocol
 [script:///opt/splunkforwarder/etc/apps/Splunk_TA_nix/bin/ps.sh]
 _rcvbuf = 1572864
 disabled = 1
 host = zds.ztacs.com
 index = default
 interval = 30
 source = ps
 sourcetype = ps
 [script:///opt/splunkforwarder/etc/apps/Splunk_TA_nix/bin/rlog.sh]
 _rcvbuf = 1572864
 disabled = 0
 host = zds.ztacs.com
 index = default
 interval = 60
 source = auditd
 sourcetype = auditd
 [script:///opt/splunkforwarder/etc/apps/Splunk_TA_nix/bin/selinuxChecker.sh]
 _rcvbuf = 1572864
 disabled = true
 host = zds.ztacs.com
 index = default
 interval = 3600
 source = Linux:SELinuxConfig
 sourcetype = Linux:SELinuxConfig
 [script:///opt/splunkforwarder/etc/apps/Splunk_TA_nix/bin/service.sh]
 _rcvbuf = 1572864
 disabled = true
 host = zds.ztacs.com
 index = default
 interval = 3600
 source = Unix:Service
 sourcetype = Unix:Service
 [script:///opt/splunkforwarder/etc/apps/Splunk_TA_nix/bin/sshdChecker.sh]
 _rcvbuf = 1572864
 disabled = true
 host = zds.ztacs.com
 index = default
 interval = 3600
 source = Unix:SSHDConfig
 sourcetype = Unix:SSHDConfig
 [script:///opt/splunkforwarder/etc/apps/Splunk_TA_nix/bin/time.sh]
 _rcvbuf = 1572864
 disabled = 0
 host = zds.ztacs.com
 index = default
 interval = 21600
 source = time
 sourcetype = time
 [script:///opt/splunkforwarder/etc/apps/Splunk_TA_nix/bin/top.sh]
 _rcvbuf = 1572864
 disabled = 1
 host = zds.ztacs.com
 index = default
 interval = 60
 source = top
 sourcetype = top
 [script:///opt/splunkforwarder/etc/apps/Splunk_TA_nix/bin/update.sh]
 _rcvbuf = 1572864
 disabled = true
 host = zds.ztacs.com
 index = default
 interval = 86400
 source = Unix:Update
 sourcetype = Unix:Update
 [script:///opt/splunkforwarder/etc/apps/Splunk_TA_nix/bin/uptime.sh]
 _rcvbuf = 1572864
 disabled = true
 host = zds.ztacs.com
 index = default
 interval = 86400
 source = Unix:Uptime
 sourcetype = Unix:Uptime
 [script:///opt/splunkforwarder/etc/apps/Splunk_TA_nix/bin/usersWithLoginPrivs.sh]
 _rcvbuf = 1572864
 disabled = 0
 host = zds.ztacs.com
 index = default
 interval = 3600
 source = usersWithLoginPrivs
 sourcetype = usersWithLoginPrivs
 [script:///opt/splunkforwarder/etc/apps/Splunk_TA_nix/bin/version.sh]
 _rcvbuf = 1572864
 disabled = true
 host = zds.ztacs.com
 index = default
 interval = 86400
 source = Unix:Version
 sourcetype = Unix:Version
 [script:///opt/splunkforwarder/etc/apps/Splunk_TA_nix/bin/vmstat.sh]
 _rcvbuf = 1572864
 disabled = 0
 host = zds.ztacs.com
 index = default
 interval = 60
 source = vmstat
 sourcetype = vmstat
 [script:///opt/splunkforwarder/etc/apps/Splunk_TA_nix/bin/vsftpdChecker.sh]
 _rcvbuf = 1572864
 disabled = true
 host = zds.ztacs.com
 index = default
 interval = 86400
 source = Unix:VSFTPDConfig
 sourcetype = Unix:VSFTPDConfig
 [script:///opt/splunkforwarder/etc/apps/Splunk_TA_nix/bin/who.sh]
 _rcvbuf = 1572864
 disabled = 0
 host = zds.ztacs.com
 index = default
 interval = 150
 source = who
 sourcetype = who
 [splunktcp]
 _rcvbuf = 1572864
 acceptFrom = *
 connection_host = ip
 host = zds.ztacs.com
 index = default
 route = has_key:tautology:parsingQueue;absent_key:tautology:parsingQueue
 [tcp]
 _rcvbuf = 1572864
 acceptFrom = *
 connection_host = dns
 host = zds.ztacs.com
 index = default
 [udp]
 _rcvbuf = 1572864
 connection_host = ip
 host = zds.ztacs.com
 index = default

Once you open the splunk console and go to Search and Reporting, filter for the hostname of your forwarder then click on sourcetype on the left hand side. You should see data already flowing across just like this: