When the Prometheus server is installed inside a Kubernetes cluster, the pods that we would like to include in the monitoring will have to have their Prometheus metrics endpoint exposed. A kubernetes service should be created for each pod sharing the exporter’s port along with “prometheus.io/scrape” = “true” annotation which will tell the Prometheus server that this service is actually pointed to an exporter. The prometheus server then automatically scrapes the target service and eventually the pod’s running exporter.
In this example the pod’s app label is prometheus-exporter which was added to selector -> app section of the yaml code below and the rest of the naming has been changed accordingly.
There are 2 notable settings here which is crucial for the successful scraping.
Define prometheus.io/scrape: “true” in annotations. This will tell the Prometheus server to scrape this service.
Define instance: prometheus-exporter in labels. This is important because by default the Prometheus server will pick up the internal ip and the service port for the instance name and it will display like that on Grafana which is not really a user friendly way of displaying data. So instead of 10.0.0.180:9696 the instance name defined will show up on Grafana.
If you use terraform to create your kubernetes services just like I would do, use the code below to do so.
In this article we will install a secure Prometheus server into an EKS/Kubernetes cluster automatically using terraform. The advantage of this installation method is that it is fully repetable and every aspect of the installation is controlled by Terraform.
This prometheus server will accept connections over https and its url will be protected by basic access authentication set on the nginx ingress. The following will be provisioned by Terraform automatically:
DNS CNAME record to your defined url.
Free SSL certificate generated for your defined url.
HTTPS secure access to your defined url.
Password protection for your defined url.
Prometheus server.
Prerequisites
In this example we will only show how to install the Prometheus Server but won’t be dealing with installing the prerequisites. The following is needed before the terraform procedure is ran:
All terraform files are published to github and can be found in kubernetes-prometheus-terraform repository. All configuration variables are located inside the variables.tf file.
prometheus_hostname your hostname/subdomain which will be accessible externally. The default is prometheus and using the default settings the full Prometheus server url would be prometheus.example.com
nginx_namespaceis the namespace where your nginx ingress controller is installed into.
nginx_name is the name of the nginx ingress controller.
Secrets Configuration
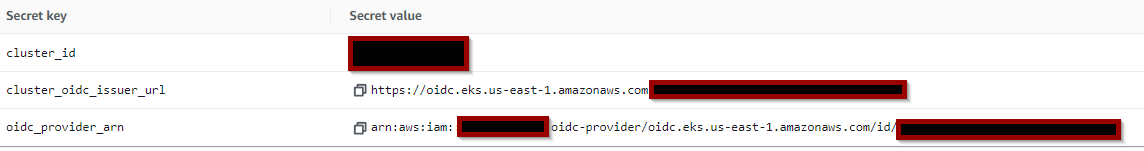
The last step is to add your kubernetes credentials as an aws secret in the AWS Secret Manager. In this example we use the name main_kubernetes for the AWS secret and you need to configure it with the following Secret keys:
This information is available on your EKS cluster’s main page.
cluster_id is the name of your cluster.
cluster_oidc_issuer_url is the “OpenID Connect provider URL” featured also on the main page of your EKS cluser.
oidc_provider_arn is located in the IAM section on your aws Console. Go to IAM -> Identity providers then click on the one with the same name as your cluster_oidc_issuer_url and copy the ARN provided in the upper right corner. Alternatively running aws iam list-open-id-connect-providers command will achieve the same.
We will need to add a kubernetes secret to secure the https url for the prometheus server. Do the following:
Run htpasswd -c auth username replace “username” with the user you intend to use to log in to your prometheus server console. This command will ask for the password you would like to use and will save the credentials in a file called “auth”.
[root@app]# htpasswd -c auth username
New password:
Re-type new password:
Adding password for user username
Run kubectl create secret generic http-auth –from-file=auth -n prometheus this will create the kubernetes secret using the credentials previously created. If you do not have the prometheus namespace created yet ( which is the case before the first run ) you can execute this step later.
Installation
Once you have completed the configuration changes for your environment you can run the terraform code manually or using any of the propular pipeline integrations like github actions, gitlab pipelines, jenkins, etc.
Verify your installation
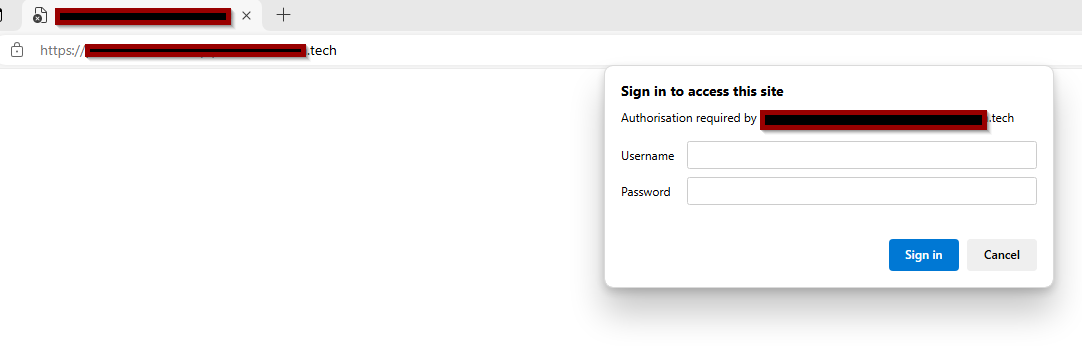
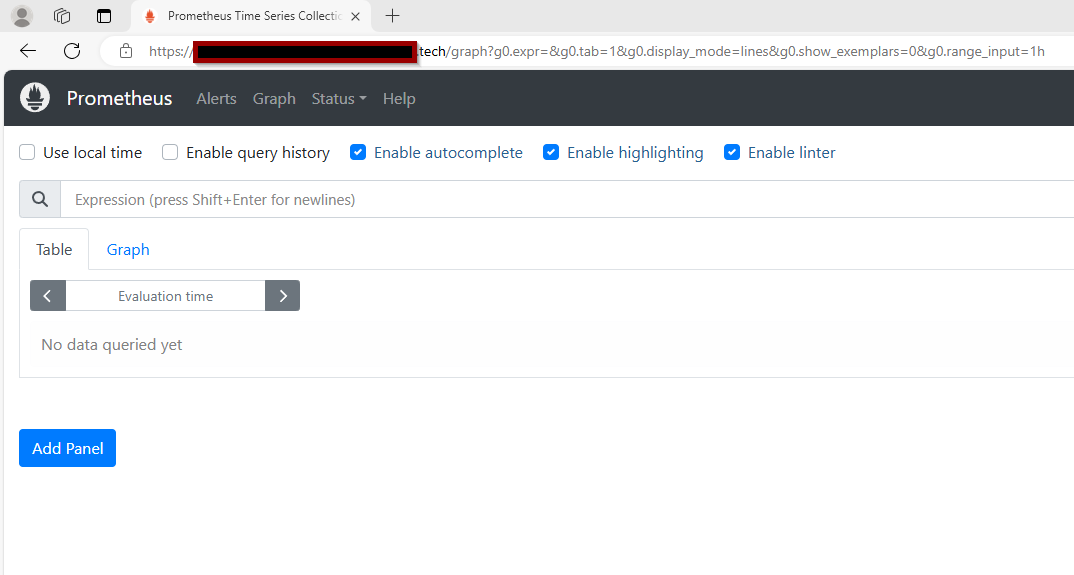
Once your terraform code successfully finished visit your url.
Enter the username and password that you have previously defined as a kuberenetes secret.
Enjoy your https and password secured Prometheus server running on EKS/Kubernetes.
Additional security options
Additonally you can set up an ip range where the url would be accessed from to further improve on security by adding the following to your terraform code. Replace 192.168.1.1/32 with your ip range or a single ip. This is useful – for example – if this prometheus instance will serve as a slave prometheus server in a federated setup.
In case you have multiple environments and networks but you still would like to manage Prometheus monitoring from one central location, one option is to set up Federation. Federation allows a Prometheus server to scrape selected time series from another Prometheus server. This is basically a master and slave configuration where the slave is acting like a beefed up exporter, exposing data from all the exporters in the network where it is located.
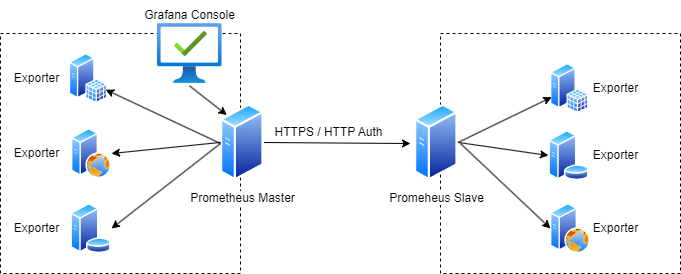
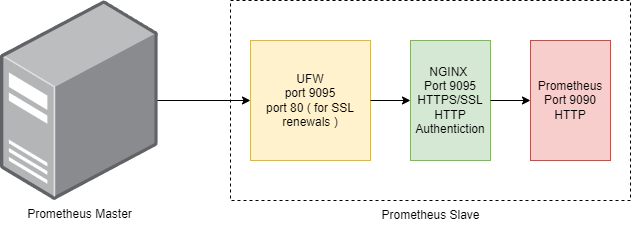
Architecture
In this example scenario we have 2 Prometheus servers where the Prometheus Master is scraping information from not only the exporters in its own network but from the Prometheus slave server too over HTTPS and using HTTP Authentication.
Prometheus doesn’t have any built in authentication nor can it use SSL certificates. We used NGINX proxying to achieve https communication and http url authentication along with local firewall settings.
Implementation
We assume that the Master Prometheus server is already installed and working correctly with the local exporters along with visualization using Grafana. In this implementation example we will focus on setting up the Slave Prometheus and to change the configuration of the Master Prometheus to enabled federation.
We used an aws t3.micro instance for the Slave Prometheus server. Once the OS is set up we will perform the following steps:
Set up firewall rules.
Set up Nginx and Certbot.
Set up SSL Certificates.
Create http password
Configure Nginx.
Set up and configure Slave Prometheus Server.
Configure Master Prometheus Server.
Set up Firewall Rules
We use ufw to configure the local Ubuntu firewall. We will need to open the following ports:
9095 – This will be the SSL port for the Slave Prometheus Server.
80 – This is required by certbot to run its own webserver when it tries to auto-renew the certficiates.
22 – SSH port.
Since ufw is available on the ubuntu image we are using, all we have to do is to run the relevant commands to configure the ports. We would only want the Master Prometheus server to access port 9095 so replace x.x.x.x with the external ip of your Master Prometheus server.
sudo ufw allow from x.x.x.x proto tcp to any port 9095/tcp
sudo ufw allow 80/tcp
sudo ufw allow 22/tcp
sudo ufw enable
Set up Nginx and Certbot
The next step is to install NGINX web server and certbot which will generate the certificates for us. We will also need to install apache2-utils to be able set the http auth password later.
In this step we will create the user and password for the http authentication. Let use prometheus-admin as username. Specify a password of your choice when prompted.
This command creates the /etc/nginx/.htpasswd file which will contain the username and password ( in encrypted format ). These credentials will be used for the Prometheus Master to connect to the Prometheus Slave.
Set up SSL Certificates
We will use certbot now to create the SSL certfificates. The prerequisite for this process is that the hostname of the Prometheus Slave is DNS resolvable. Let’s say the resolvable name of our server is prometheus-slave.example.com we will use this throughout the example.
This will create the certificates for you in the /etc/letsencrypt/live/prometheus-slave directory.
Add the following to your crontab, this command will try to renew the certificates automatically every 12 hours and restarts the nginx server when it runs successfully.
Now we need to copy and enable the configuration on nginx. We will also delete the default nginx configuration. Execute this command sequence from the location where you created the nginx.config file.
We now use the following script to download the latest Prometheus version from github.
#!/bin/bash
ARCH="linux-amd64"

GITHUB_URL="https://api.github.com/repos/prometheus/prometheus/releases/latest"
RELEASE_DATA=$(curl -s $GITHUB_URL)

VERSION=$(echo $RELEASE_DATA | grep -oP '"tag_name": "\K(.*?)(?=")')
ASSETS_URL=$(echo $RELEASE_DATA | grep -oP '"browser_download_url": "\K(.*?)(?=")' | grep "$ARCH.tar.gz")

if [[ -z "$VERSION" ]] || [[ -z "$ASSETS_URL" ]]; then
    echo "Failed to find the latest Prometheus version or the download URL."
    exit 1
fi

wget "$ASSETS_URL" -O prometheus-${VERSION}-${ARCH}.tar.gz || curl -L "$ASSETS_URL" -o prometheus-${VERSION}-${ARCH}.tar.gz
echo "Extracting Prometheus $VERSION..."
tar xvf prometheus-${VERSION}-${ARCH}.tar.gz
We now have the latest Prometheus version downloaded and extracted. Let’s move the files to their final location and create the required directories. Run the following command sequence from the same directory where the prometheus files have been extracted.
Edit the /etc/prometheus/prometheus.yml file and add your local exporters. As an example we add a job with the name of CoreSystems and add 4 targets to the group. We use the internal ip address and hostname for the targets so scraping traffic is only happening on the internal network. You would typically have to append each job definition at to end of the file.
# my global config
global:
  scrape_interval: 15s # Set the scrape interval to every 15 seconds. Default is every 1 minute.
  evaluation_interval: 15s # Evaluate rules every 15 seconds. The default is every 1 minute.
  # scrape_timeout is set to the global default (10s).

# Alertmanager configuration
alerting:
  alertmanagers:
    - static_configs:
        - targets:
          # - alertmanager:9093

# Load rules once and periodically evaluate them according to the global 'evaluation_interval'.
rule_files:
  # - "first_rules.yml"
  # - "second_rules.yml"

# A scrape configuration containing exactly one endpoint to scrape:
# Here it's Prometheus itself.
scrape_configs:
  # The job name is added as a label `job=<job_name>` to any timeseries scraped from this config.
  - job_name: "prometheus"

    # metrics_path defaults to '/metrics'
    # scheme defaults to 'http'.

    static_configs:
      - targets: ["localhost:9090"]
# -------------------------
# Custom targets and groups start here
# --------------------------
  - job_name: 'CoreSystems'
    static_configs:
    - targets: ['core01.example.internal:9100']
    - targets: ['core02.example.internal:9100']
    - targets: ['core03.example.internal:9100']
    - targets: ['core04.example.internal:9100']
      labels:
        group: 'CoreSystems Monitoring'
Run the commands below from the directory where you created the service file. This will create the prometheus linux service, enable it to autostart at reboot and at the same time will start the service.
As the Prometheus Master Server has already been set up all we need to do is to add a new job at the end of the /etc/prometheus/prometheus.yaml file to enable scraping from the Prometheus Slave Server. Very likely you already have some other jobs configured in that configuration file, you do not need to remove them, they will be compatible with the federated setup. Change the user and the password at the bottom of the file to whatever you are used at the http credentials setup.
This configuration will scrape everything that is available on the Slave Prometheus Server. if you only need to scrape specific data you can set that up at the params section.