Category Archives: Ubuntu

How to configure NGINX Load Balancer on Ubuntu 22?

Introduction

In this post we will set up a Load Balancer using the nginx‘s HTTP Load Balancing on Ubuntu 22. The requirement was that the load balancer is running over https and balances the connections for 4 polkadot based RPC servers. Please note that this setup would work with any other environments including standard web servers over https.

Prerequisities

  • Ubuntu 22 is set up on the Load Balancer server.
  • All backend servers are created and working properly.
  • the loadbalancer domain lb.yourdomain.com is redirecing correctly to the server.

Create SSL certficate

We use certbot to create the SSL certificate for lb.yourdomain.com using the following commands:

sudo snap install --classic certbot
sudo ln -s /snap/bin/certbot /usr/bin/certbot
sudo certbot certonly --standalone --noninteractive --agree-tos --cert-name lb -d lb.yourdomain.com -m yourmail@yourdomain.com -v

This will generate 2 certificate files:

/etc/letsencrypt/live/lb/fullchain.pem
/etc/letsencrypt/live/lb/privkey.pem

Install nginx server.

sudo apt install nginx  -y

Create the nginx.conf file and add the content below and replace the domain and SSL parameters with your settings.

upstream backend {
server server1.yourdomain.com:443;
server server2.yourdomain.com:443;
server server3.yourdomain.com:443;
server server4.yourdomain.com:443;
}

server {
        server_name lb.yourdomain.com;
        root /var/www/html;
        location / {
          try_files $uri $uri/ =404;
          proxy_buffering off;
          proxy_pass https://backend;
          proxy_set_header X-Real-IP $remote_addr;
          proxy_set_header Host $host;
          proxy_set_header X-Forwarded-For $proxy_add_x_forwarded_for;
          proxy_http_version 1.1;
          proxy_set_header Upgrade $http_upgrade;
          proxy_set_header Connection "upgrade";
        }
        listen [::]:443 ssl ipv6only=on;
        listen 443 ssl;
        ssl_certificate /etc/letsencrypt/live/lb/fullchain.pem;
        ssl_certificate_key /etc/letsencrypt/live/lb/privkey.pem;
        ssl_dhparam /snap/certbot/current/lib/python3.8/site-packages/certbot/ssl-dhparams.pem;
        ssl_session_cache shared:cache_nginx_SSL:1m;
        ssl_session_timeout 1440m;
        ssl_protocols TLSv1 TLSv1.1 TLSv1.2;
        ssl_prefer_server_ciphers on;
        ssl_ciphers "ECDHE-ECDSA-CHACHA20-POLY1305:ECDHE-RSA-CHACHA20-POLY1305:ECDHE-ECDSA-AES128-GCM-SHA256:ECDHE-RSA-AES128-GCM-SHA256:ECDHE
-ECDSA-AES256-GCM-SHA384:ECDHE-RSA-AES256-GCM-SHA384:DHE-RSA-AES128-GCM-SHA256:DHE-RSA-AES256-GCM-SHA384:ECDHE-ECDSA-AES128-SHA256:ECDHE-RSA-A
ES128-SHA256:ECDHE-ECDSA-AES128-SHA:ECDHE-RSA-AES256-SHA384:ECDHE-RSA-AES128-SHA:ECDHE-ECDSA-AES256-SHA384:ECDHE-ECDSA-AES256-SHA:ECDHE-RSA-AE
S256-SHA:DHE-RSA-AES128-SHA256:DHE-RSA-AES128-SHA:DHE-RSA-AES256-SHA256:DHE-RSA-AES256-SHA:ECDHE-ECDSA-DES-CBC3-SHA:ECDHE-RSA-DES-CBC3-SHA:EDH
-RSA-DES-CBC3-SHA:AES128-GCM-SHA256:AES256-GCM-SHA384:AES128-SHA256:AES256-SHA256:AES128-SHA:AES256-SHA:DES-CBC3-SHA:!DSS";
}

Copy the nginx.conf file to its final destination and remove the old config.

sudo cp --verbose nginx.conf /etc/nginx/sites-available/nginx.conf
sudo ln -s /etc/nginx/sites-available/nginx.conf /etc/nginx/sites-enabled/nginx.conf
sudo rm -rf /etc/nginx/sites-enabled/default

Restart the nginx server to activate your configuration.

sudo service nginx restart

Even though certbot schedules automatic renewal of the SSL certificates, it won’t restart the nginx server. The new certificates to take effect if the nginx server is restarted after the SSL cert renewal, so alternatively you can add the following line to crontab.

0 */12 * * * /usr/bin/certbot renew --quiet && /usr/bin/systemctl restart nginx

This will try to renew the SSL certificate every 12 hours and if it was successful will restart the nginx server.

How to install Ta-Lib and its python library on Ubuntu 22?

Installing TA-lib on an Ubuntu server has its challenges as not only the python library has to be installed but the product should be downloaded and compiled first. Use the following steps to perform the installation:

mkdir -p /app
sudo apt-get install build-essential autoconf libtool pkg-config python3-dev -y
cd /app
sudo wget http://prdownloads.sourceforge.net/ta-lib/ta-lib-0.4.0-src.tar.gz
sudo tar -xzf ta-lib-0.4.0-src.tar.gz
cd ta-lib/
sudo ./configure
sudo make
sudo make install
sudo pip3 install --upgrade pip
sudo pip3 install TA-Lib

In case you would be using gitlab pipelines you can use the following job to do the same:

 stages:
   - prepare

 prepare:
   stage: prepare
   script:
     - mkdir -p /app
     - sudo apt-get install build-essential autoconf libtool pkg-config       python3-dev -y
     - cd /app
     - sudo wget http://prdownloads.sourceforge.net/ta-lib/ta-lib-0.4.0-src.tar.gz
     - sudo tar -xzf ta-lib-0.4.0-src.tar.gz
     - cd ta-lib/
     - sudo ./configure
     - sudo make
     - sudo make install
     - sudo pip3 install --upgrade pip
     - sudo pip3 install TA-Lib

Happy trading!

StandardOutput log file is not updating after the linux service restarts

I ran into this issue recently. I have created a linux service on Ubuntu, defined the StandardOutput to redirect logging to a file and anytime I restarted the service the log file didn’t update.

The first problem was that the logfile actually did update but it updated from the beginning of the file keeping the older lines and updatig the logfile gradually which is a very weird behaviour I would say.

The way this was fixed is that I have changed the StandardOutput definition in my service file from:

StandardOutput=file:/var/log/application.log

to

StandardOutput=append:/var/log/application.log

This means if the file doesn’t exists it will be created if it does exits it will just append the new log lines to the existing file instead of update the file from the very beginning causing confusion.

How to gain root access to a pod on OpenShift

By default you do not have root access on any of the pods created on Openshift. If you still need root access for development or other purposes follow these simple steps to gain root:

Log in to your bastion box and switch project to the one you would like to work with:

oc project projectname

Create a service account that resembles the name of the project. We installed a zabbix container hence I used zabbix in the name.

oc create sa zabbix-nfs-sa

Give the service account privileged access.

oc adm policy add-scc-to-user privileged -z zabbix-nfs-sa

Now add the following to the relevant Deployment Config yaml. Remember you won’t be able to change this on a running pod.

The securityContext should be present with the default value of {}. You can replace that with the definition above.

The serviceAccountName and ServiceAccount are not present with the yaml file so you can add them right under or above the securityContext definition.

Once you have edited the yaml file, save it and it will automatically get updated on the pod.

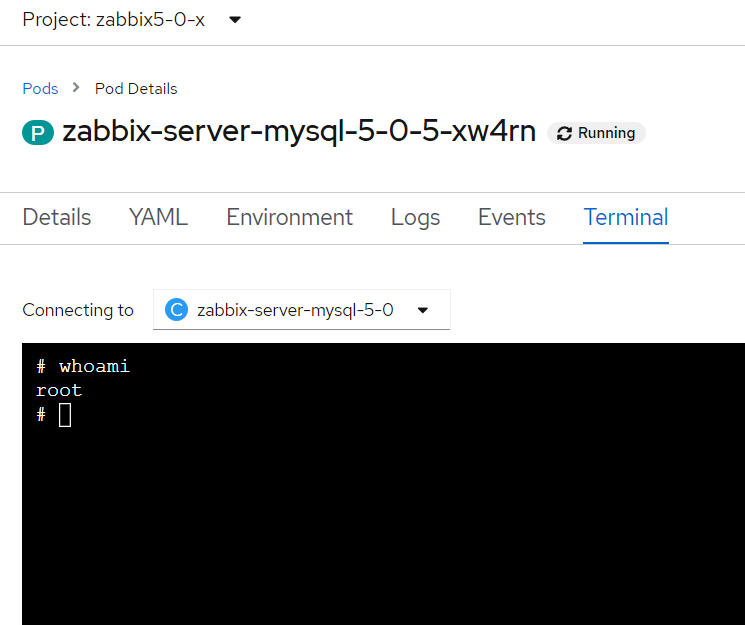
If everything goes fine you should see this when you navigate to the terminal tab of your POD:

Install and Enable Splunk Add-On for Unix and Linux on a Splunk Forwarder

We assume that you have a splunk enteprise server installed and the Splunk Add-On for Unix addon downloaded and installed on the server side.

We now go ahead and install the same on an ubuntu 18.4.0 forwarder.

Upload the same package you used on your server for the installation onto the splunk forwarder. At the time of writing this file is splunk-add-on-for-unix-and-linux_602.tgz

Untar the file to a location of your choice:

tar -xvzf splunk-add-on-for-unix-and-linux_602.tgz

Copy the Splunk_TA_nix directory and its contents across to the splunk addons directory:

cp -R /app/images/splunk_linux/Splunk_TA_nix /opt/splunkforwarder/etc/apps

The default configuration file for the Splunk Add-On for Unix addon has all stanzas disabled. Edit the /opt/splunkforwarder/etc/apps/Splunk_TA_nix/default/inputs.conf configuration file and change the disabled = 1 sections to disabled = 0 at the stanzas you would like to get covered. We disabled the ps and top sections at the test environment as they were generating way too much traffic. We used the following inputs.conf:

Copyright (C) 2019 Splunk Inc. All Rights Reserved.
 [script://./bin/vmstat.sh]
 interval = 60
 sourcetype = vmstat
 source = vmstat
 disabled = 0
 [script://./bin/iostat.sh]
 interval = 60
 sourcetype = iostat
 source = iostat
 disabled = 0
 [script://./bin/nfsiostat.sh]
 interval = 60
 sourcetype = nfsiostat
 source = nfsiostat
 disabled = 0
 [script://./bin/ps.sh]
 interval = 30
 sourcetype = ps
 source = ps
 disabled = 1
 [script://./bin/top.sh]
 interval = 60
 sourcetype = top
 source = top
 disabled = 1
 [script://./bin/netstat.sh]
 interval = 60
 sourcetype = netstat
 source = netstat
 disabled = 0
 [script://./bin/bandwidth.sh]
 interval = 60
 sourcetype = bandwidth
 source = bandwidth
 disabled = 0
 [script://./bin/protocol.sh]
 interval = 60
 sourcetype = protocol
 source = protocol
 disabled = 0
 [script://./bin/openPorts.sh]
 interval = 300
 sourcetype = openPorts
 source = openPorts
 disabled = 0
 [script://./bin/time.sh]
 interval = 21600
 sourcetype = time
 source = time
 disabled = 0
 [script://./bin/lsof.sh]
 interval = 600
 sourcetype = lsof
 source = lsof
 disabled = 0
 [script://./bin/df.sh]
 interval = 300
 sourcetype = df
 source = df
 disabled = 0
 Shows current user sessions
 [script://./bin/who.sh]
 sourcetype = who
 source = who
 interval = 150
 disabled = 0
 Lists users who could login (i.e., they are assigned a login shell)
 [script://./bin/usersWithLoginPrivs.sh]
 sourcetype = usersWithLoginPrivs
 source = usersWithLoginPrivs
 interval = 3600
 disabled = 0
 Shows last login time for users who have ever logged in
 [script://./bin/lastlog.sh]
 sourcetype = lastlog
 source = lastlog
 interval = 300
 disabled = 0
 Shows stats per link-level Etherner interface (simply, NIC)
 [script://./bin/interfaces.sh]
 sourcetype = interfaces
 source = interfaces
 interval = 60
 disabled = 0
 Shows stats per CPU (useful for SMP machines)
 [script://./bin/cpu.sh]
 sourcetype = cpu
 source = cpu
 interval = 30
 disabled = 0
 This script reads the auditd logs translated with ausearch
 [script://./bin/rlog.sh]
 sourcetype = auditd
 source = auditd
 interval = 60
 disabled = 0
 Run package management tool collect installed packages
 [script://./bin/package.sh]
 sourcetype = package
 source = package
 interval = 3600
 disabled = 0
 [script://./bin/hardware.sh]
 sourcetype = hardware
 source = hardware
 interval = 36000
 disabled = 0
 [monitor:///Library/Logs]
 disabled = 1
 [monitor:///var/log]
 whitelist=(.log|log$|messages|secure|auth|mesg$|cron$|acpid$|.out)
 blacklist=(lastlog|anaconda.syslog)
 disabled = 1
 [monitor:///var/adm]
 whitelist=(.log|log$|messages)
 disabled = 0
 [monitor:///etc]
 whitelist=(.conf|.cfg|config$|.ini|.init|.cf|.cnf|shrc$|^ifcfg|.profile|.rc|.rules|.tab|tab$|.login|policy$)
 disabled = 1
 bash history
 [monitor:///root/.bash_history]
 disabled = true
 sourcetype = bash_history
 [monitor:///home/*/.bash_history]
 disabled = true
 sourcetype = bash_history
 Added for ES support
 Note that because the UNIX app uses a single script to retrieve information
 from multiple OS flavors, and is intended to run on Universal Forwarders,
 it is not possible to differentiate between OS flavors by assigning
 different sourcetypes for each OS flavor (e.g. Linux:SSHDConfig), as was
 the practice in the older deployment-apps included with ES. Instead,
 sourcetypes are prefixed with the generic "Unix".
 May require Splunk forwarder to run as root on some platforms.
 [script://./bin/openPortsEnhanced.sh]
 disabled = true
 interval = 3600
 source = Unix:ListeningPorts
 sourcetype = Unix:ListeningPorts
 [script://./bin/passwd.sh]
 disabled = true
 interval = 3600
 source = Unix:UserAccounts
 sourcetype = Unix:UserAccounts
 Only applicable to Linux
 [script://./bin/selinuxChecker.sh]
 disabled = true
 interval = 3600
 source = Linux:SELinuxConfig
 sourcetype = Linux:SELinuxConfig
 Currently only supports SunOS, Linux, OSX.
 May require Splunk forwarder to run as root on some platforms.
 [script://./bin/service.sh]
 disabled = true
 interval = 3600
 source = Unix:Service
 sourcetype = Unix:Service
 Currently only supports SunOS, Linux, OSX.
 May require Splunk forwarder to run as root on some platforms.
 [script://./bin/sshdChecker.sh]
 disabled = true
 interval = 3600
 source = Unix:SSHDConfig
 sourcetype = Unix:SSHDConfig
 Currently only supports Linux, OSX.
 May require Splunk forwarder to run as root on some platforms.
 [script://./bin/update.sh]
 disabled = true
 interval = 86400
 source = Unix:Update
 sourcetype = Unix:Update
 [script://./bin/uptime.sh]
 disabled = true
 interval = 86400
 source = Unix:Uptime
 sourcetype = Unix:Uptime
 [script://./bin/version.sh]
 disabled = true
 interval = 86400
 source = Unix:Version
 sourcetype = Unix:Version
 This script may need to be modified to point to the VSFTPD configuration file.
 [script://./bin/vsftpdChecker.sh]
 disabled = true
 interval = 86400
 source = Unix:VSFTPDConfig
 sourcetype = Unix:VSFTPDConfig

The last step is to restart the splunk forwarder:

/opt/splunkforwarder/bin/splunk restart

Now verify if the changes took place by running:

/opt/splunkforwarder/bin/splunk cmd btool inputs list

You should see all the Linux OS related monitoring options listed. Just like this:

[SSL]
 _rcvbuf = 1572864
 allowSslRenegotiation = true
 cipherSuite = ECDHE-ECDSA-AES256-GCM-SHA384:ECDHE-RSA-AES256-GCM-SHA384:ECDHE-ECDSA-AES128-GCM-SHA256:ECDHE-RSA-AES128-GCM-SHA256:ECDHE-ECDSA-AES256-SHA384:ECDHE-RSA-AES256-SHA384:ECDHE-ECDSA-AES128-SHA256:ECDHE-RSA-AES128-SHA256
 ecdhCurves = prime256v1, secp384r1, secp521r1
 host = zds.ztacs.com
 index = default
 sslQuietShutdown = false
 sslVersions = tls1.2
 [batch:///opt/splunkforwarder/var/run/splunk/search_telemetry/*search_telemetry.json]
 _rcvbuf = 1572864
 crcSalt = 

 host = zds.ztacs.com
 index = _introspection
 log_on_completion = 0
 move_policy = sinkhole
 sourcetype = search_telemetry
 [batch:///opt/splunkforwarder/var/spool/splunk]
 _rcvbuf = 1572864
 crcSalt = 

 host = zds.ztacs.com
 index = default
 move_policy = sinkhole
 [batch:///opt/splunkforwarder/var/spool/splunk/…stash_new]
 _rcvbuf = 1572864
 crcSalt = 

 host = zds.ztacs.com
 index = default
 move_policy = sinkhole
 queue = stashparsing
 sourcetype = stash_new
 [blacklist:/opt/splunkforwarder/etc/auth]
 _rcvbuf = 1572864
 host = zds.ztacs.com
 index = default
 [blacklist:/opt/splunkforwarder/etc/passwd]
 _rcvbuf = 1572864
 host = zds.ztacs.com
 index = default
 [fschange:/opt/splunkforwarder/etc]
 _rcvbuf = 1572864
 delayInMills = 100
 filesPerDelay = 10
 followLinks = false
 fullEvent = false
 hashMaxSize = -1
 host = zds.ztacs.com
 index = default
 pollPeriod = 600
 recurse = true
 sendEventMaxSize = -1
 signedaudit = true
 [http]
 _rcvbuf = 1572864
 allowSslCompression = true
 allowSslRenegotiation = true
 dedicatedIoThreads = 2
 disabled = 1
 enableSSL = 1
 host = zds.ztacs.com
 index = default
 maxSockets = 0
 maxThreads = 0
 port = 8088
 sslVersions = *,-ssl2
 useDeploymentServer = 0
 [monitor:///Library/Logs]
 _rcvbuf = 1572864
 disabled = 1
 host = zds.ztacs.com
 index = default
 [monitor:///etc]
 _rcvbuf = 1572864
 disabled = 1
 host = zds.ztacs.com
 index = default
 whitelist = (.conf|.cfg|config$|.ini|.init|.cf|.cnf|shrc$|^ifcfg|.profile|.rc|.rules|.tab|tab$|.login|policy$)
 [monitor:///home/*/.bash_history]
 _rcvbuf = 1572864
 disabled = true
 host = zds.ztacs.com
 index = default
 sourcetype = bash_history
 [monitor:///opt/splunkforwarder/etc/splunk.version]
 _TCP_ROUTING = *
 _rcvbuf = 1572864
 host = zds.ztacs.com
 index = _internal
 sourcetype = splunk_version
 [monitor:///opt/splunkforwarder/var/log/splunk]
 _rcvbuf = 1572864
 host = zds.ztacs.com
 index = _internal
 [monitor:///opt/splunkforwarder/var/log/splunk/license_usage_summary.log]
 _rcvbuf = 1572864
 host = zds.ztacs.com
 index = _telemetry
 [monitor:///opt/splunkforwarder/var/log/splunk/metrics.log]
 _TCP_ROUTING = *
 _rcvbuf = 1572864
 host = zds.ztacs.com
 index = _internal
 [monitor:///opt/splunkforwarder/var/log/splunk/splunkd.log]
 _TCP_ROUTING = *
 _rcvbuf = 1572864
 host = zds.ztacs.com
 index = _internal
 [monitor:///opt/splunkforwarder/var/log/watchdog/watchdog.log*]
 _rcvbuf = 1572864
 host = zds.ztacs.com
 index = _internal
 [monitor:///root/.bash_history]
 _rcvbuf = 1572864
 disabled = true
 host = zds.ztacs.com
 index = default
 sourcetype = bash_history
 [monitor:///var/adm]
 _rcvbuf = 1572864
 disabled = 0
 host = zds.ztacs.com
 index = default
 whitelist = (.log|log$|messages)
 [monitor:///var/log]
 _rcvbuf = 1572864
 blacklist = (lastlog|anaconda.syslog)
 disabled = 1
 host = zds.ztacs.com
 index = default
 whitelist = (.log|log$|messages|secure|auth|mesg$|cron$|acpid$|.out)
 [monitor:///var/log/apache2/zds_access.log]
 _rcvbuf = 1572864
 disabled = false
 host = zds.ztacs.com
 index = default
 sourcetype = access_log
 [monitor:///var/log/syslog]
 _rcvbuf = 1572864
 disabled = false
 host = zds.ztacs.com
 index = remotelogs
 sourcetype = linux_logs
 [script]
 _rcvbuf = 1572864
 host = zds.ztacs.com
 index = default
 interval = 60.0
 start_by_shell = true
 [script:///opt/splunkforwarder/etc/apps/Splunk_TA_nix/bin/bandwidth.sh]
 _rcvbuf = 1572864
 disabled = 0
 host = zds.ztacs.com
 index = default
 interval = 60
 source = bandwidth
 sourcetype = bandwidth
 [script:///opt/splunkforwarder/etc/apps/Splunk_TA_nix/bin/cpu.sh]
 _rcvbuf = 1572864
 disabled = 0
 host = zds.ztacs.com
 index = default
 interval = 30
 source = cpu
 sourcetype = cpu
 [script:///opt/splunkforwarder/etc/apps/Splunk_TA_nix/bin/df.sh]
 _rcvbuf = 1572864
 disabled = 0
 host = zds.ztacs.com
 index = default
 interval = 300
 source = df
 sourcetype = df
 [script:///opt/splunkforwarder/etc/apps/Splunk_TA_nix/bin/hardware.sh]
 _rcvbuf = 1572864
 disabled = 0
 host = zds.ztacs.com
 index = default
 interval = 36000
 source = hardware
 sourcetype = hardware
 [script:///opt/splunkforwarder/etc/apps/Splunk_TA_nix/bin/interfaces.sh]
 _rcvbuf = 1572864
 disabled = 0
 host = zds.ztacs.com
 index = default
 interval = 60
 source = interfaces
 sourcetype = interfaces
 [script:///opt/splunkforwarder/etc/apps/Splunk_TA_nix/bin/iostat.sh]
 _rcvbuf = 1572864
 disabled = 0
 host = zds.ztacs.com
 index = default
 interval = 60
 source = iostat
 sourcetype = iostat
 [script:///opt/splunkforwarder/etc/apps/Splunk_TA_nix/bin/lastlog.sh]
 _rcvbuf = 1572864
 disabled = 0
 host = zds.ztacs.com
 index = default
 interval = 300
 source = lastlog
 sourcetype = lastlog
 [script:///opt/splunkforwarder/etc/apps/Splunk_TA_nix/bin/lsof.sh]
 _rcvbuf = 1572864
 disabled = 0
 host = zds.ztacs.com
 index = default
 interval = 600
 source = lsof
 sourcetype = lsof
 [script:///opt/splunkforwarder/etc/apps/Splunk_TA_nix/bin/netstat.sh]
 _rcvbuf = 1572864
 disabled = 0
 host = zds.ztacs.com
 index = default
 interval = 60
 source = netstat
 sourcetype = netstat
 [script:///opt/splunkforwarder/etc/apps/Splunk_TA_nix/bin/nfsiostat.sh]
 _rcvbuf = 1572864
 disabled = 0
 host = zds.ztacs.com
 index = default
 interval = 60
 source = nfsiostat
 sourcetype = nfsiostat
 [script:///opt/splunkforwarder/etc/apps/Splunk_TA_nix/bin/openPorts.sh]
 _rcvbuf = 1572864
 disabled = 0
 host = zds.ztacs.com
 index = default
 interval = 300
 source = openPorts
 sourcetype = openPorts
 [script:///opt/splunkforwarder/etc/apps/Splunk_TA_nix/bin/openPortsEnhanced.sh]
 _rcvbuf = 1572864
 disabled = true
 host = zds.ztacs.com
 index = default
 interval = 3600
 source = Unix:ListeningPorts
 sourcetype = Unix:ListeningPorts
 [script:///opt/splunkforwarder/etc/apps/Splunk_TA_nix/bin/package.sh]
 _rcvbuf = 1572864
 disabled = 0
 host = zds.ztacs.com
 index = default
 interval = 3600
 source = package
 sourcetype = package
 [script:///opt/splunkforwarder/etc/apps/Splunk_TA_nix/bin/passwd.sh]
 _rcvbuf = 1572864
 disabled = true
 host = zds.ztacs.com
 index = default
 interval = 3600
 source = Unix:UserAccounts
 sourcetype = Unix:UserAccounts
 [script:///opt/splunkforwarder/etc/apps/Splunk_TA_nix/bin/protocol.sh]
 _rcvbuf = 1572864
 disabled = 0
 host = zds.ztacs.com
 index = default
 interval = 60
 source = protocol
 sourcetype = protocol
 [script:///opt/splunkforwarder/etc/apps/Splunk_TA_nix/bin/ps.sh]
 _rcvbuf = 1572864
 disabled = 1
 host = zds.ztacs.com
 index = default
 interval = 30
 source = ps
 sourcetype = ps
 [script:///opt/splunkforwarder/etc/apps/Splunk_TA_nix/bin/rlog.sh]
 _rcvbuf = 1572864
 disabled = 0
 host = zds.ztacs.com
 index = default
 interval = 60
 source = auditd
 sourcetype = auditd
 [script:///opt/splunkforwarder/etc/apps/Splunk_TA_nix/bin/selinuxChecker.sh]
 _rcvbuf = 1572864
 disabled = true
 host = zds.ztacs.com
 index = default
 interval = 3600
 source = Linux:SELinuxConfig
 sourcetype = Linux:SELinuxConfig
 [script:///opt/splunkforwarder/etc/apps/Splunk_TA_nix/bin/service.sh]
 _rcvbuf = 1572864
 disabled = true
 host = zds.ztacs.com
 index = default
 interval = 3600
 source = Unix:Service
 sourcetype = Unix:Service
 [script:///opt/splunkforwarder/etc/apps/Splunk_TA_nix/bin/sshdChecker.sh]
 _rcvbuf = 1572864
 disabled = true
 host = zds.ztacs.com
 index = default
 interval = 3600
 source = Unix:SSHDConfig
 sourcetype = Unix:SSHDConfig
 [script:///opt/splunkforwarder/etc/apps/Splunk_TA_nix/bin/time.sh]
 _rcvbuf = 1572864
 disabled = 0
 host = zds.ztacs.com
 index = default
 interval = 21600
 source = time
 sourcetype = time
 [script:///opt/splunkforwarder/etc/apps/Splunk_TA_nix/bin/top.sh]
 _rcvbuf = 1572864
 disabled = 1
 host = zds.ztacs.com
 index = default
 interval = 60
 source = top
 sourcetype = top
 [script:///opt/splunkforwarder/etc/apps/Splunk_TA_nix/bin/update.sh]
 _rcvbuf = 1572864
 disabled = true
 host = zds.ztacs.com
 index = default
 interval = 86400
 source = Unix:Update
 sourcetype = Unix:Update
 [script:///opt/splunkforwarder/etc/apps/Splunk_TA_nix/bin/uptime.sh]
 _rcvbuf = 1572864
 disabled = true
 host = zds.ztacs.com
 index = default
 interval = 86400
 source = Unix:Uptime
 sourcetype = Unix:Uptime
 [script:///opt/splunkforwarder/etc/apps/Splunk_TA_nix/bin/usersWithLoginPrivs.sh]
 _rcvbuf = 1572864
 disabled = 0
 host = zds.ztacs.com
 index = default
 interval = 3600
 source = usersWithLoginPrivs
 sourcetype = usersWithLoginPrivs
 [script:///opt/splunkforwarder/etc/apps/Splunk_TA_nix/bin/version.sh]
 _rcvbuf = 1572864
 disabled = true
 host = zds.ztacs.com
 index = default
 interval = 86400
 source = Unix:Version
 sourcetype = Unix:Version
 [script:///opt/splunkforwarder/etc/apps/Splunk_TA_nix/bin/vmstat.sh]
 _rcvbuf = 1572864
 disabled = 0
 host = zds.ztacs.com
 index = default
 interval = 60
 source = vmstat
 sourcetype = vmstat
 [script:///opt/splunkforwarder/etc/apps/Splunk_TA_nix/bin/vsftpdChecker.sh]
 _rcvbuf = 1572864
 disabled = true
 host = zds.ztacs.com
 index = default
 interval = 86400
 source = Unix:VSFTPDConfig
 sourcetype = Unix:VSFTPDConfig
 [script:///opt/splunkforwarder/etc/apps/Splunk_TA_nix/bin/who.sh]
 _rcvbuf = 1572864
 disabled = 0
 host = zds.ztacs.com
 index = default
 interval = 150
 source = who
 sourcetype = who
 [splunktcp]
 _rcvbuf = 1572864
 acceptFrom = *
 connection_host = ip
 host = zds.ztacs.com
 index = default
 route = has_key:tautology:parsingQueue;absent_key:tautology:parsingQueue
 [tcp]
 _rcvbuf = 1572864
 acceptFrom = *
 connection_host = dns
 host = zds.ztacs.com
 index = default
 [udp]
 _rcvbuf = 1572864
 connection_host = ip
 host = zds.ztacs.com
 index = default

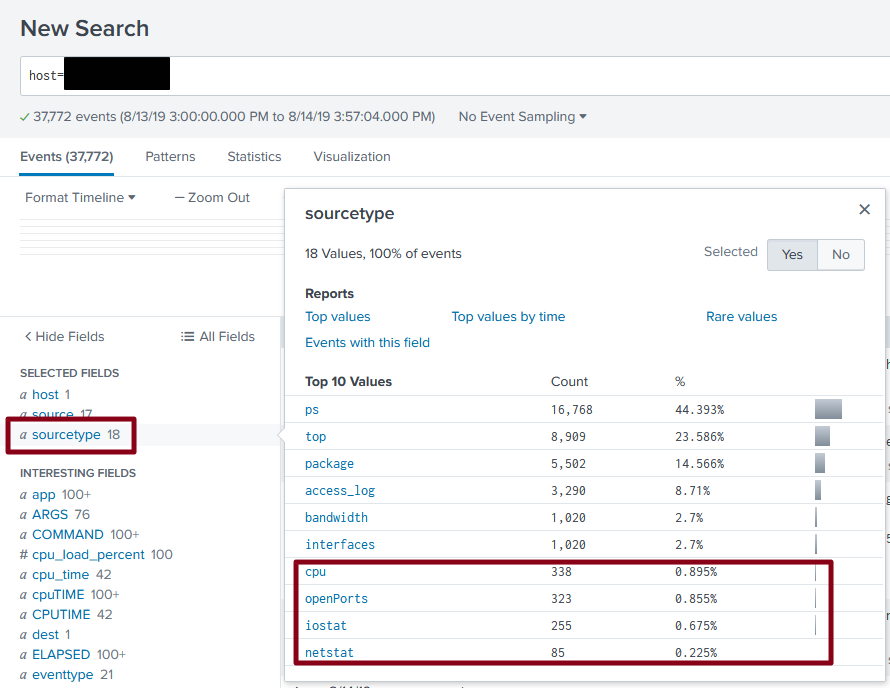
Once you open the splunk console and go to Search and Reporting, filter for the hostname of your forwarder then click on sourcetype on the left hand side. You should see data already flowing across just like this:

Splunk Cheat Sheet

List active stanzas on Linux forwarder

/opt/splunkforwarder/bin/splunk cmd btool inputs list

List active stanzas and show locations on Linux forwarder

/opt/splunkforwarder/bin/splunk cmd btool inputs list --debug

Add a new log to the on a linux forwarder stanzas ( in this example we add the apache access log )

/opt/splunkforwarder/bin/splunk add monitor /var/log/apache2/zds_access.log -index default -sourcetype access_log

Remove log from stanzas on a linux forwarder ( in this example we add the apache access log )

/opt/splunkforwarder/bin/splunk remove monitor /var/log/apache2/zds_access.log

View all sourcetypes by typing the following to the search field on the splunk console

| metadata type=sourcetypes index=* OR index=_*

How to install Zabbix Proxy on Windows?

In certain customer environments only windows based servers are allowed on the network. Previously this was a showstopper for zabbix proxy and server implementations. Fortunately with the new windows architectures there is a way to install Zabbix Server or Zabbix Proxy on windows.

In this walkthrough we will install the Zabbix proxy on windows server 2019. Windows Server 2019 and Windows 10 comes with the WSL option which stands for Windows Subsystem for Linux.

Windows Subsystem for Linux (WSL) is a new Windows 10/Windows Server 2019 feature that enables you to run native Linux command-line tools directly on Windows, alongside your traditional Windows desktop and modern store apps.

There are multiple options available for Linux distributions in WSL. We will however pick ubuntu server 18.4 for our demonstration.

First we will need to enable the WLS option on Windows Server 2019 by executing the following command in powershell. Don’t forget to open powershell as administrator.

Enable-WindowsOptionalFeature -Online -FeatureName Microsoft-Windows-Subsystem-Linux

Reboot to server to enable the WSL feature. The next step is to download the relevant ubuntu WSL image using the following command:

Invoke-WebRequest -Uri https://aka.ms/wsl-ubuntu-1804 -OutFile Ubuntu.appx -UseBasicParsing

This will download the latest ubuntu 18.04 WSL image.

Once the image is downloaded we created the ubuntu directory and extracted the image file.

PS C:\Users\Administrator> mkdir \ubuntu
PS C:\Users\Administrator> mv Ubuntu.appx Ubuntu.zip
PS C:\Users\Administrator> Expand-Archive Ubuntu.zip c:\ubuntu
PS C:\Users\Administrator> cd \Ubuntu
PS C:\ubuntu> dir
Mode                LastWriteTime         Length Name

----                -------------         ------ ----
d-----         5/8/2019   1:35 AM                AppxMetadata
d-----         5/8/2019   1:35 AM                Assets
-a----        8/17/2018   3:15 AM         212438 AppxBlockMap.xml
-a----        8/17/2018   3:15 AM           3835 AppxManifest.xml
-a----        8/17/2018   3:17 AM          11112 AppxSignature.p7x
-a----        8/17/2018   3:15 AM      223983209 install.tar.gz
-a----        8/17/2018   3:15 AM           5400 resources.pri
-a----         5/8/2019   1:30 AM      224629284 Ubuntu.zip
-a----        8/17/2018   3:15 AM         211968 ubuntu1804.exe
-a----        8/17/2018   3:15 AM            744 [Content_Types].xml

Set the user environment variables by executing the following command:

$userenv = System.Environment::GetEnvironmentVariable("Path", "User") 
[System.Environment]::SetEnvironmentVariable("PATH", $userenv + "C:\ubuntu", "User")

Install the ubuntu instance by executing ubuntu1804.exe from c:\ubuntu. As part of the installation we defined our first ubuntu user as seen below. Once the session is open you can start using your ubuntu instance right away. The ubuntu session will look like a powershell window which is pretty cool. It will be using the same hostname, memory, disks, etc as the windows host. You basically have access to every resource the windows OS has but you are still running a full featured ubuntu server.

PS C:\ubuntu> .\ubuntu1804.exe
Installing, this may take a few minutes…
Please create a default UNIX user account. The username does not need to match your Windows username.
For more information visit: https://aka.ms/wslusers
Enter new UNIX username: user
Enter new UNIX password:
Retype new UNIX password:
passwd: password updated successfully
Installation successful!
To run a command as administrator (user "root"), use "sudo ".
See "man sudo_root" for details.

user@WIN-72UH30KQAK4:~$ sudo su -
 [sudo] password for user:
 root@WIN-72UH30KQAK4:~#

We defined the zabbix repo that matches our distribution. We install zabbix 4.0 LTS in this example.

wget https://repo.zabbix.com/zabbix/4.0/ubuntu/pool/main/z/zabbix-release/zabbix-release_4.0-2+bionic_all.deb
dpkg -i zabbix-release_4.0-2+bionic_all.deb
apt update
apt upgrade

After the ubuntu system is on the latest software level we install the zabbix proxy. We used the MySQL based zabbix proxy installation which will install mariadb as part of the proxy installation.

apt install zabbix-proxy-mysql

Once the proxy is installed we create the zabbix database and user with the following commands.

mysql -u root
create database zabbix character set utf8 collate utf8_bin;
grant all privileges on zabbix.* to 'zabbix'@'localhost' identified by 'yourpassword';
quit;

We now create the database schemas for the Zabbix Proxy.

zcat /usr/share/doc/zabbix-proxy-mysql/schema.sql.gz | mysql -uzabbix -p [yourpassword]

The next step is to edit the /etc/zabbix/zabbix_proxy.conf file with your parameters. We use an encrypted active connection between the zabbix proxy and the zabbix server. Hence we also use certificates in the configuration file.

We added the database connection settings to the configuration file:

DBHost=localhost
DBName=zabbix
DBUser=zabbix
DBPassword=<yourpassword>

We are not going to go into detail on how to set up the rest of the proxy configuration file. Please follow the official instructions to set up your own configuration parameters in the configuration file.

Before we can start the zabbix proxy we need to create the proxy on the zabbix console. Open your zabbix frontend and go to Administration->Proxies and click “Create proxy” on the upper right corner.

We filled in the hostname of the zabbix proxy and picked the relevant Encryption level checkbox. We used “Cerfiticate”.

If all goes well you will see your new proxy connected like this on the zabbix console.

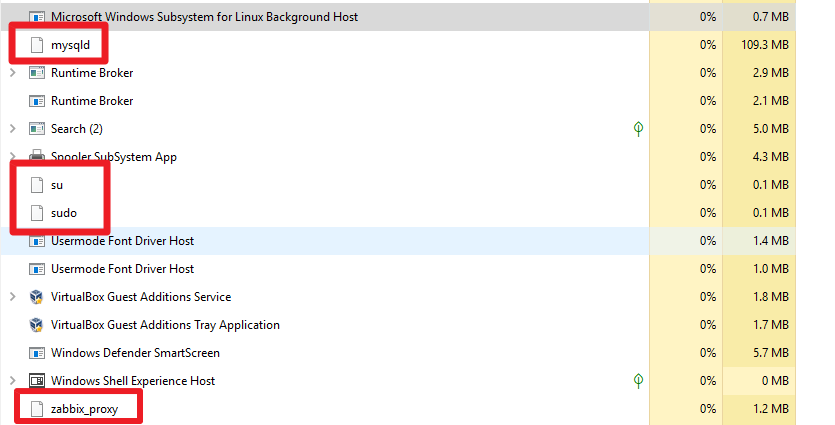
the resource usage of the mysqld, zabbix-proxy and ubuntu processes show up in the windows task manager like a normal windows process.

Whenever we need to interact with the ubuntu server we can open a session using the following icon on taskbar. The server keeps running regardless these sessions are open or closed.

If you have windows firewall enabled on your server, make sure that your proxy port is open across so agents can connect to it.

The next and last step we had to do is to make sure that the mysql and zabbix-proxy service starts when the windows server is rebooted. By default ubuntu init.d services are not respected so we had to do the following:

Add the following lines to the /etc/sudoers file on ubuntu:

%sudo   ALL=(ALL) NOPASSWD: /usr/sbin/service zabbix-proxy *
%sudo   ALL=(ALL) NOPASSWD: /usr/sbin/service mysql *

Create startservices.sh on ubuntu with the following content:

!/bin/bash
sudo service mysql start
sudo service zabbix-proxy start

Cretate autostart.vbs on the windows server with the following content.

Set WshShell = CreateObject("WScript.Shell") 
WshShell.Run "C:\Windows\System32\bash.exe -c /app/startservices.sh",0
Set WshShell = Nothing

Schedule this script to run at start up.

How to set up multitenancy @ Appdynamics Controller

Setting up multitenancy in Appdynamics is relatively easy. This is basically a setting at the controller’s admin console not to be confused with the standard console. You can access your controller admin console at  http://hostname:8090/controller/admin.jsp

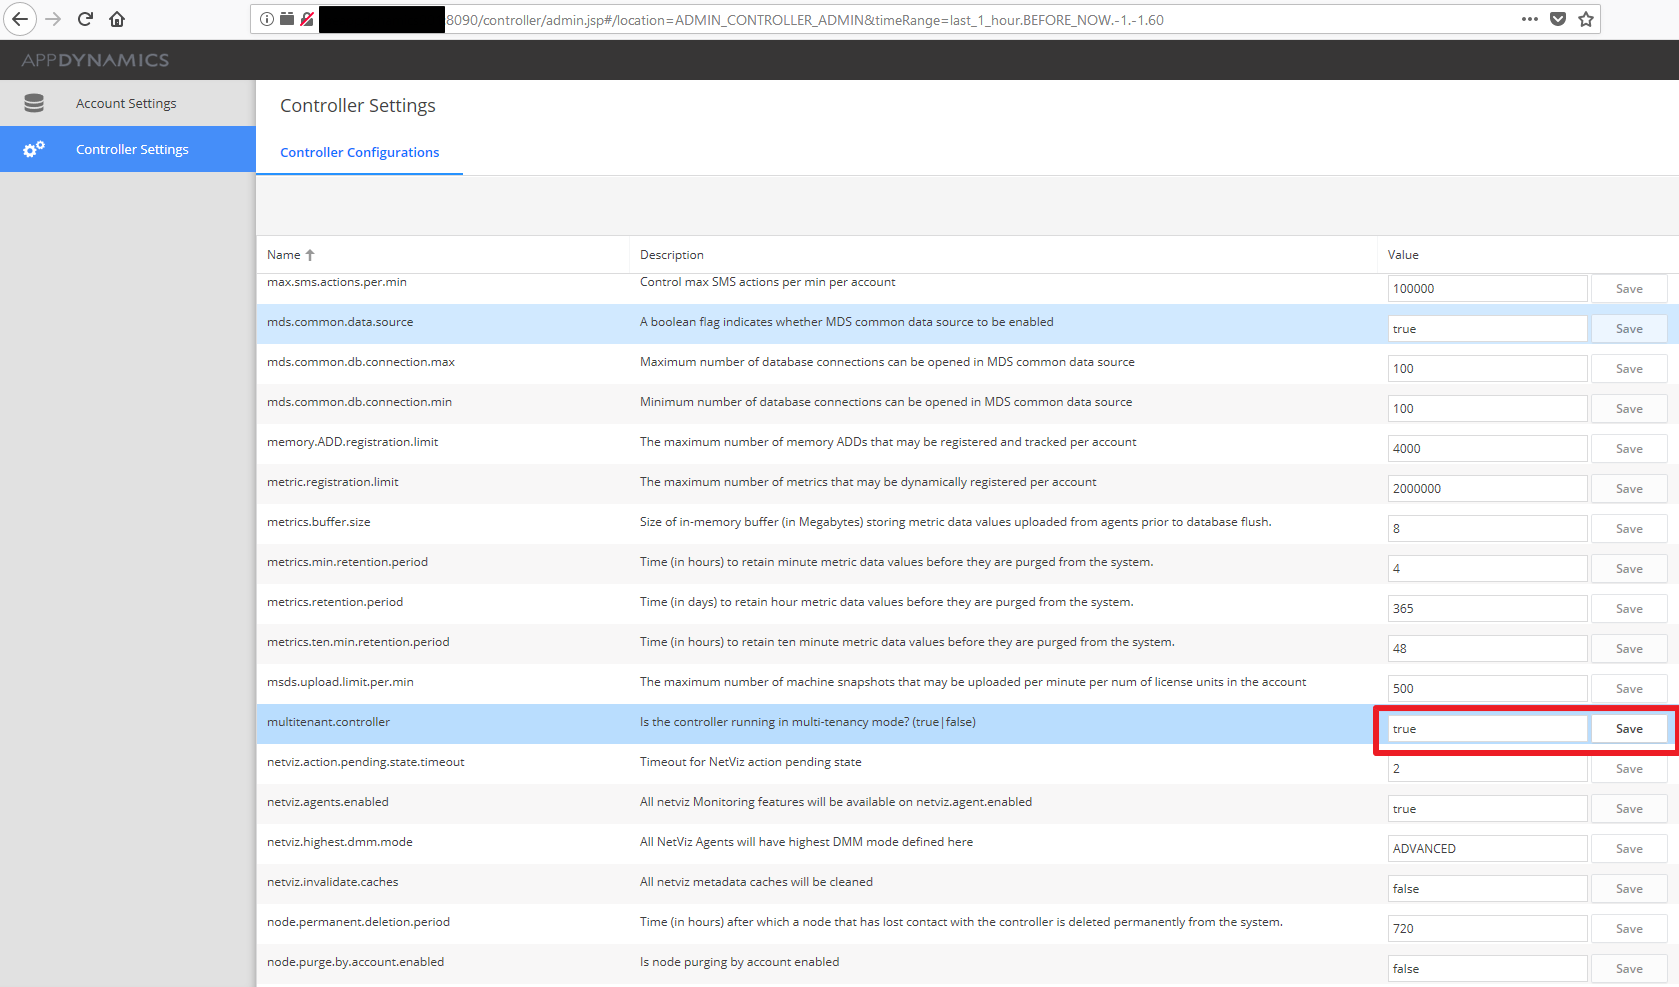
Once you are logged into the controller’s admin backend click on Controller Settings, then locate multitenant.controller setting and set it to true. Please note that once you set your controller to multitenant mode it can not be switched back anymore.

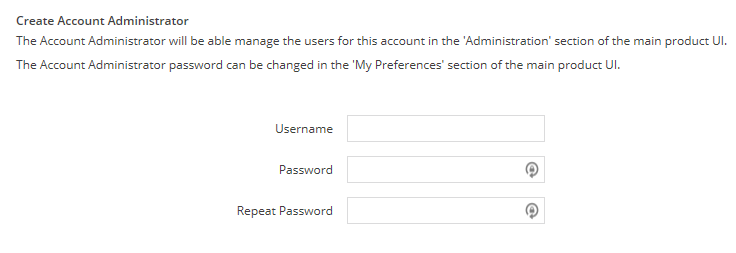
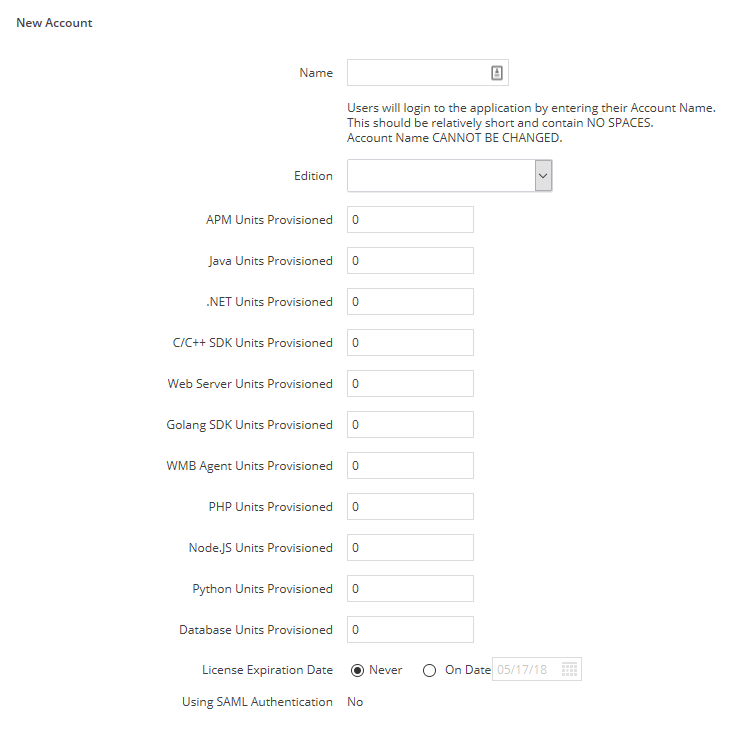
Click Account Settings to and click Add set up a new customer account. You have to specify the  account admin user, its password.

Also specify the number of licenses you want to use for this account and the account’s name.

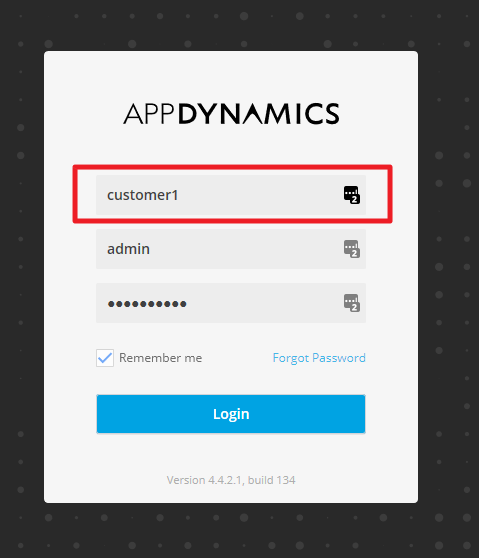
Once the account is set up you can log off this console and try logging in to your Appdynamics admin panel by visiting https://hostname:8090.

You should see a new field on the login screen asking for the account name you would like use along with the user id and password. Specify your recently created account name, the account admin user and its password to log in.

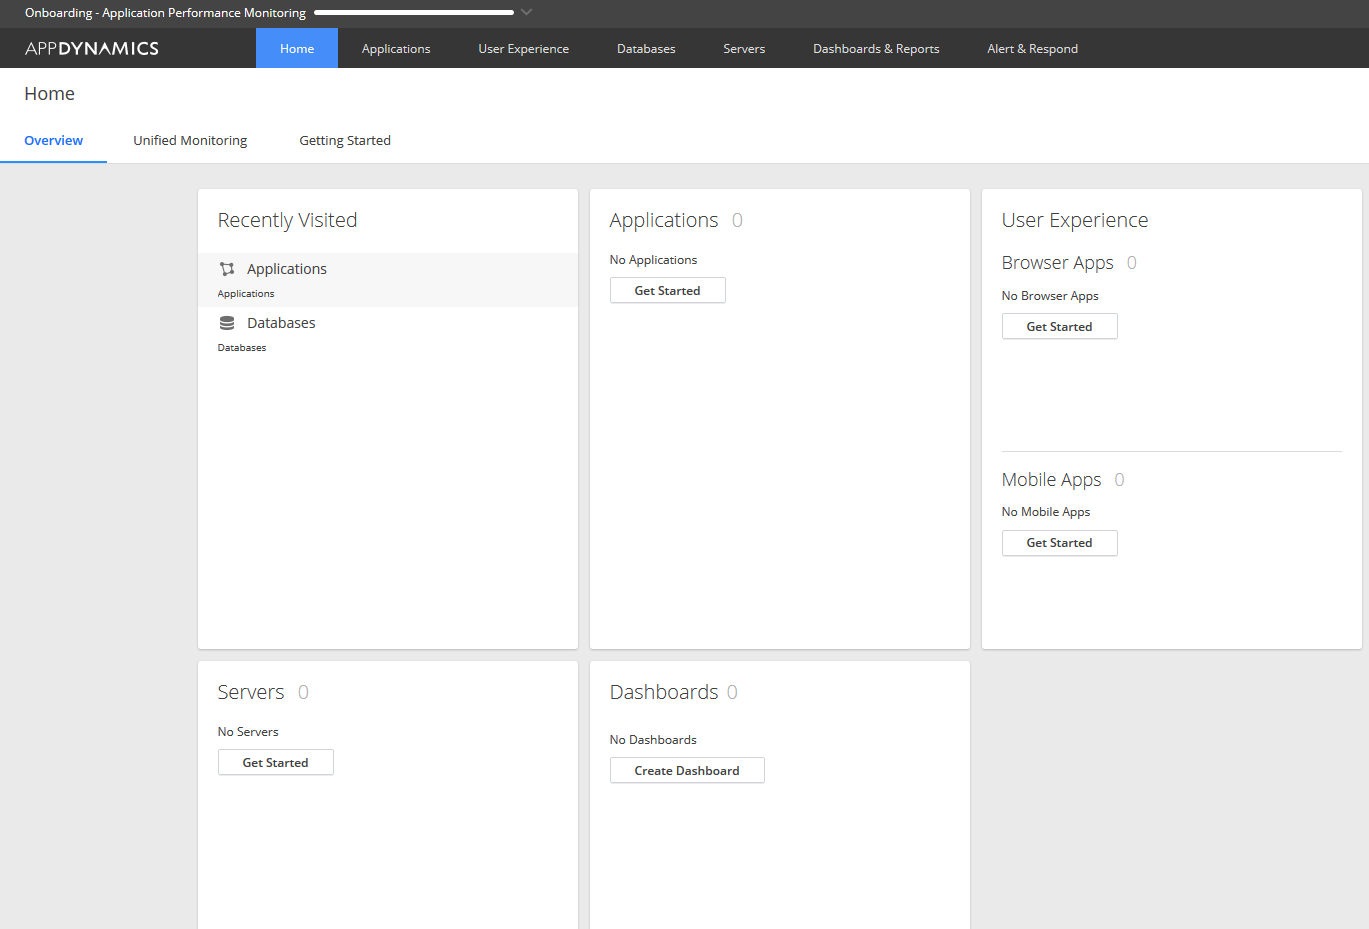
You should see an empty console when you log in just like this one below.

If you would like to add agents to this newly created account you will have to use the new account name and its account access key ( can be found at the account setup in the controller admin console ) at installation time or just simply change these settings in the controller-info.xml if you already have agents on those servers. Using separate account name and account access key for each customer is how Appdynamics separates one account from an other.

Installing Appdynamics Machine Agent on Ubuntu 16.04.4

Downloading and installing the Appdynamics Machine Agent

We have recently set up a test environment with a PHP/MySQL based test Ubuntu 16.04.4 server. We will now set up monitoring for Linux OS, PHP 7.0 and MySQL.

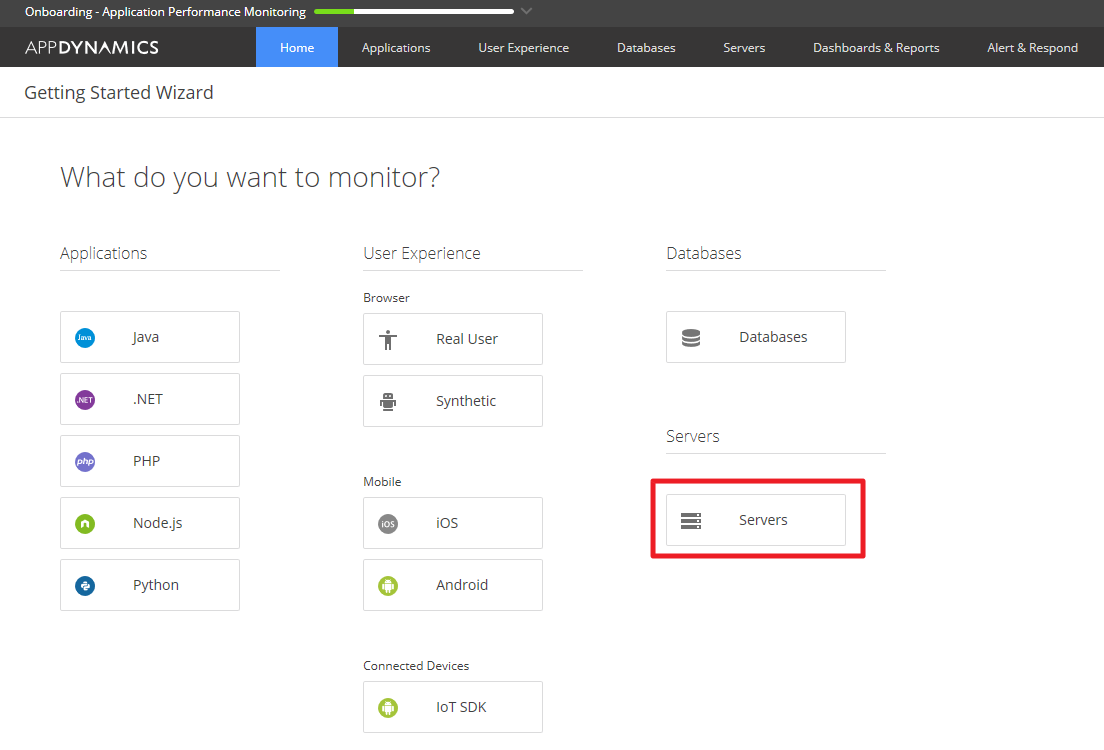
The first step is to install the PHP Agent the next step is to downloading the machine agent. Open your Appdynamics console and select the Getting Started Wizard.

Then click the Server button on the What do you want to monitor? screen.

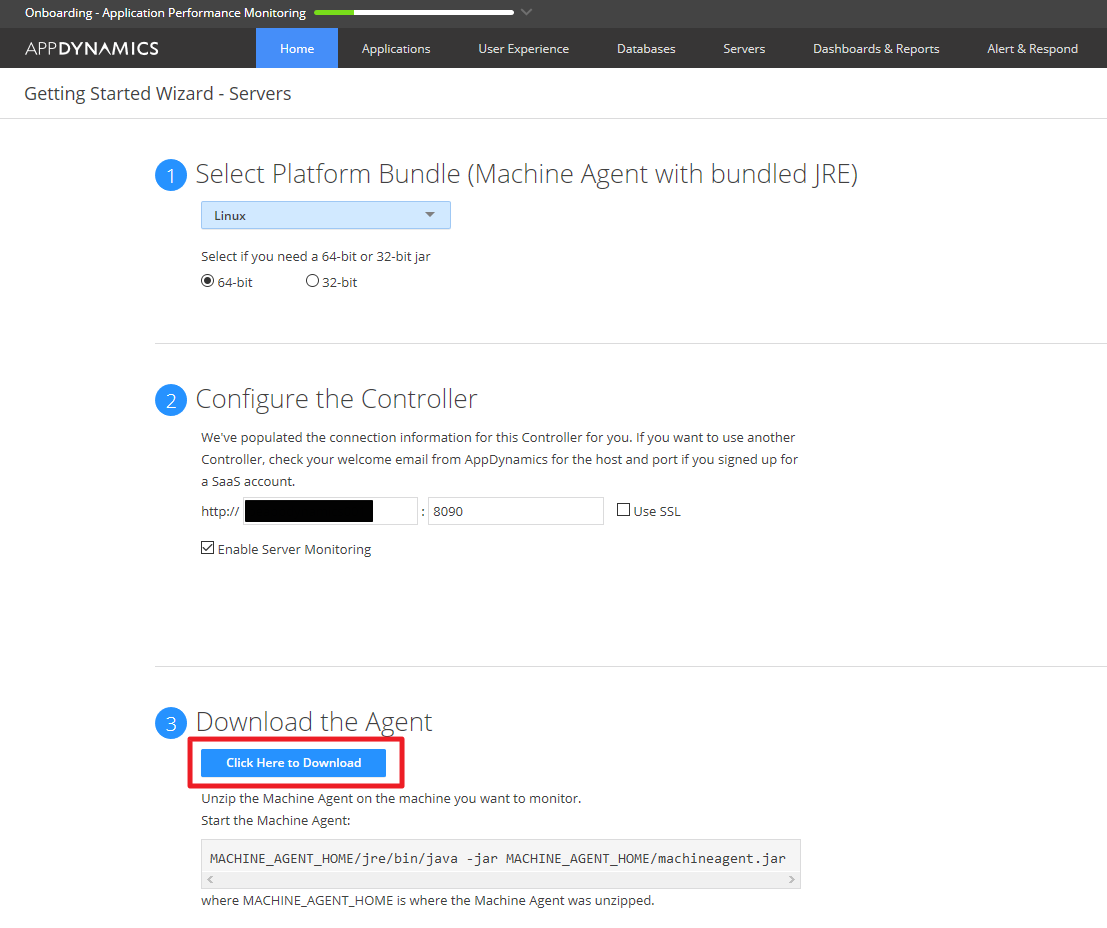
At the next screen check if the connection details are correct then click the click here to download  button to acquire the Machine Agent.

Upload the downloaded zip file to your ubuntu server, unpack it to a desired location. This is where you want to run the machine agent from.

Check if the hostname of the appdynamics server is resolvable by simply pinging it, and also check if you can telnet into the port defined in the Configure the Controller step ( above ). The Machine Agent zip should contain the configuration files pre-configured with all the connection details, so in this case we do not have to do this manually. Run the machine agent as root using the following command:

[Your-agent-director]/bin/machine-agent &

root@HUAPPD001-P1:/app/appdynamics/machineagent/bin# ./machine-agent
Using java executable at /app/appdynamics/machineagent/jre/bin/java
Using Java Version [1.8.0_111] for Agent
Using Agent Version [Machine Agent v4.4.3.1214 GA Build Date 2018-04-28 05:12:10]
[INFO] Agent logging directory set to: [/app/appdynamics/machineagent]
Machine Agent Install Directory :/app/appdynamics/machineagent
Machine Agent Temp Directory :/app/appdynamics/machineagent/tmp
Tasks Root Directory :/app/appdynamics/machineagent/controlchannel
[INFO] Agent logging directory set to: [/app/appdynamics/machineagent]
Redirecting all logging statements to the configured logger
15:05:30.460 [system-thread-0] DEBUG com.appdynamics.common.framework.util.EmbeddedModeSecurityManager - Installed
15:05:30.490 [system-thread-0] INFO com.appdynamics.analytics.agent.AnalyticsAgent - Starting analytics agent with arguments [-p, /app/appdynamics/machineagent/monitors/analytics-agent/conf/analytics-agent.properties, -yr, analytics-agent.yml]
Started AppDynamics Machine Agent Successfully.

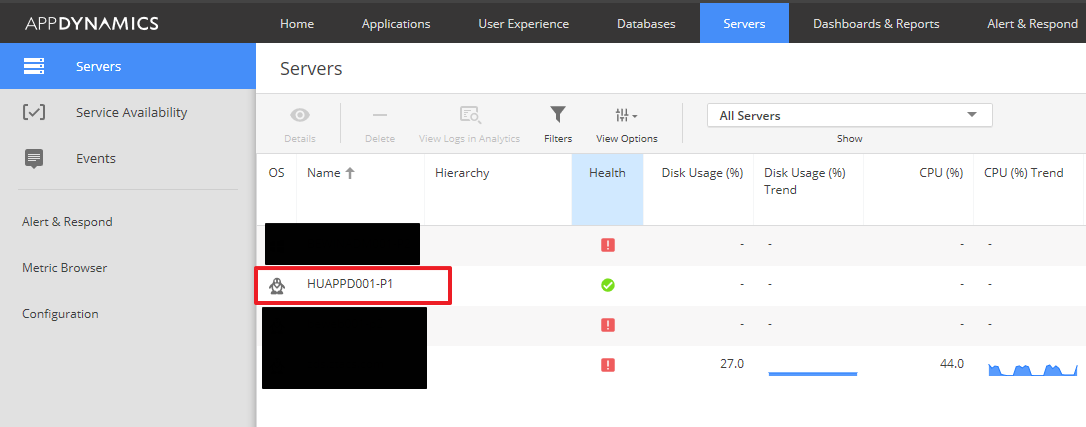
Once the agent is started it should automatically show up on the appdynamics console in the servers section.

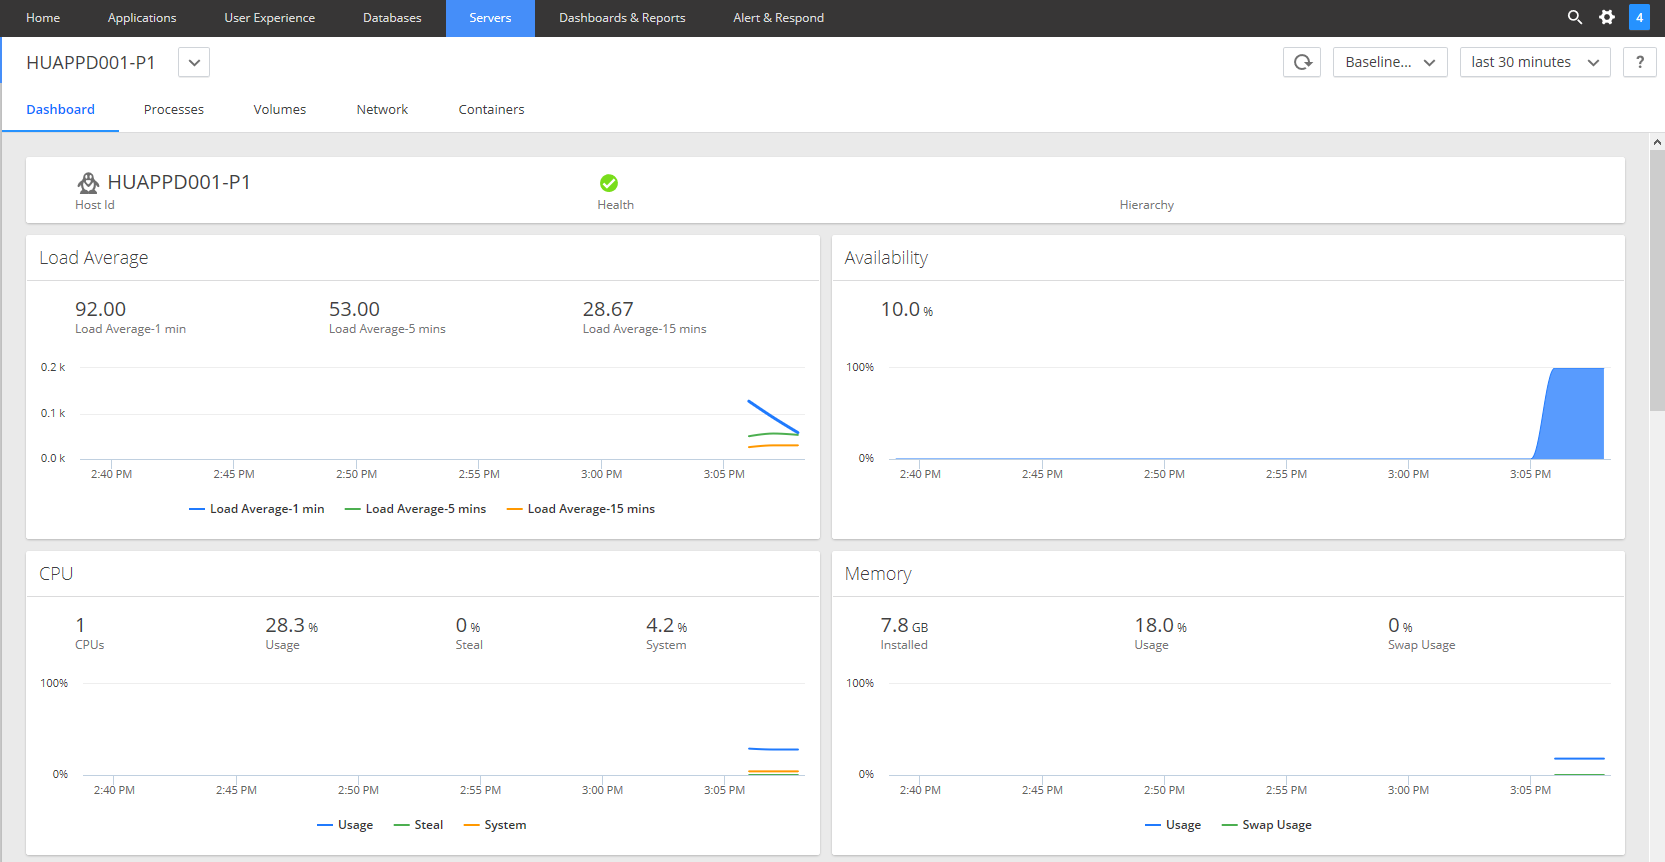
Click on the machine’s name to open the detailed OS monitoring dashboard.

If you run into connection errors you can check and change the connection settings in the configuration file:

[Your-agent-director]/conf/controller-info.xml

Assign the machine agent automatically to an application and to its tiers and nodes

If you only want to use the machine agent on this server, you can hard wire the Application, Tier and Node details in the contoller-info.xml. Please note that if you use for example the PHP Agent on the same box this might stop the PHP Agent to connect to the controller.

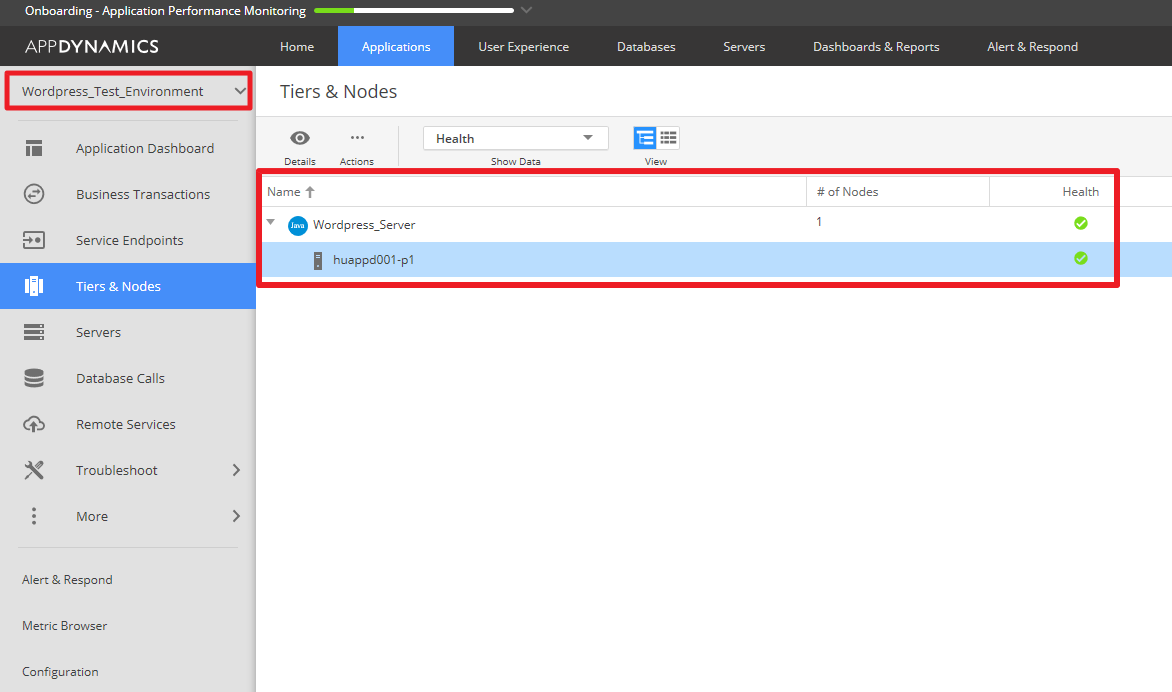
There is no need to create the tiers and nodes manually they will be created on the dashboard automatically. We only added the WordPress_Test_Environment Application before the agent assignment. You will need to add the following to the controller-info.xml configuration file:

<force-agent-registration>true</force-agent-registration>
<application-name>WordPress_Test_Environment</application-name>
<tier-name>WordPress_Server</tier-name>
<node-name>huappd001-p1</node-name>

Change the name of the application, tier and node according to your specifications and restart the agent. Once the agent is restarted navigate into the application and verify if the machine agent has been added successfully.